Integrating DataSunrise with Splunk Enterprise
Splunk Enterprise is a platform for operational intelligence. It is used to collect and evaluate big data generated by various applications. Splunk Enterprise provides a lot of features but for the purpose of DataSunrise it could be used for aggregation of audit logs.
In this manual, we describe how to configure Splunk Enterprise to integrate it with DataSunrise. Data audit results are exported from DataSunrise to Splunk via Syslog. For the purpose of demonstration, a trial copy of Splunk Enterprise is used. You can download it from the official website. Before you try to use Splunk for collecting data audit logs, configure DataSunrise Syslog.
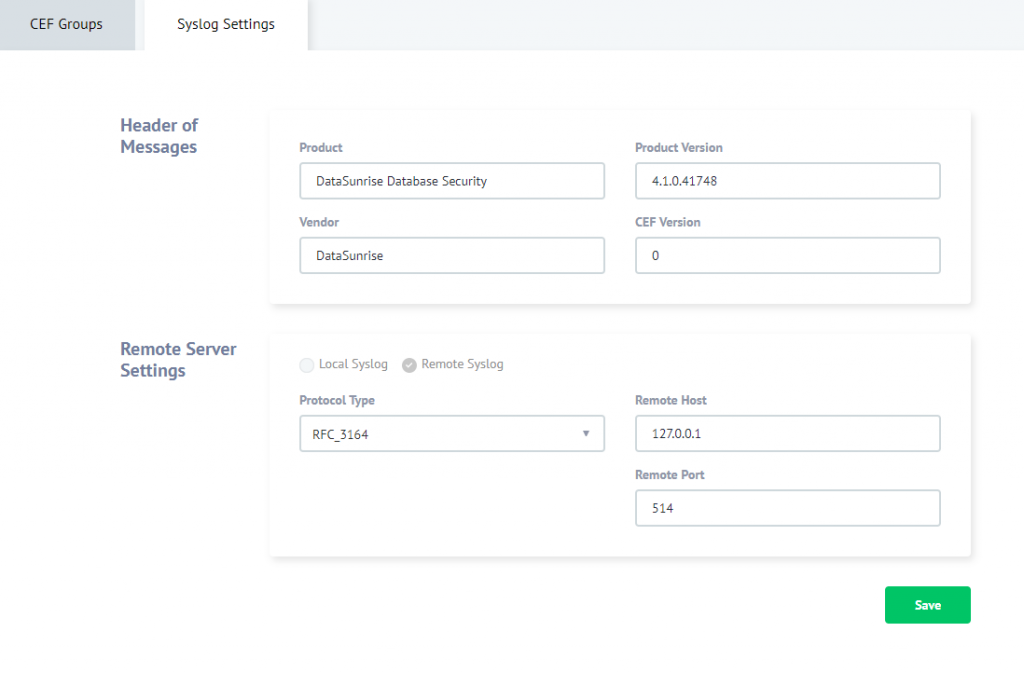
To do this, enter the DataSunrise’s GUI, “Configurations” -> “Syslog settings”, “Syslog Settings” and configure a remote Syslog server (see the screen shot below). Since our Splunk is installed on our PC where DataSunrise is installed, the Server hosts’s value is 127.0.0.1. Port number is 514.
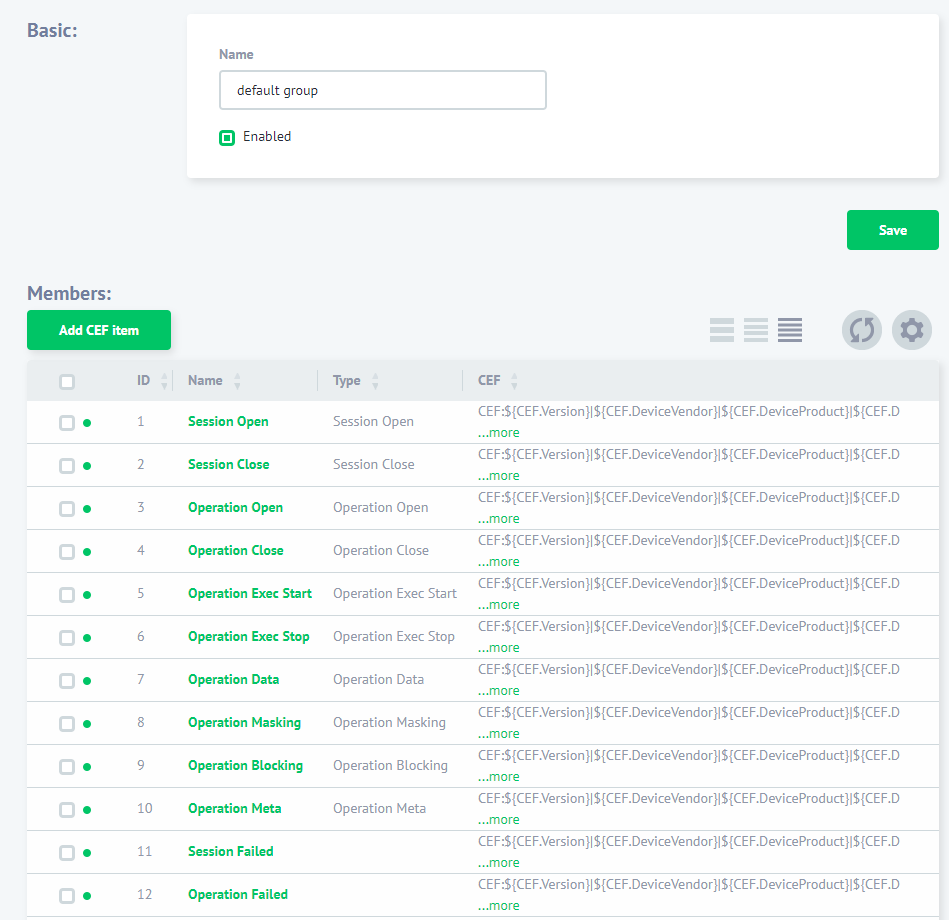
Then navigate to the “Configurations” -> “Syslog Settings” and create a new CEF Group if necessary or use the “default group”. You need to include events, you want to pass to Syslog, into the group.
Then create a DataSunrise Rule and in the rule’s settings, “Actions” subsection, select your CEF group from the “Syslog Configuration” drop-down list. This will enable you to pass audit data collected by DataSunrise to Splunk through Syslog. For more details refer to the DataSunrise User Guide. Then in the “Filter Statements” select “Sessions Events” and specify session events to send Syslog messages about.
There are Splunk Enterprise versions for Windows, UNIX and Mac OS operating systems, thus every program version has its own specifics. In this guide, we describe Splunk setup on Windows and Linux. To prepare the program for work, performs the following:
Splunk Enterprise installation
Windows
Perform the standard installation procedure for Windows applications. Refer to the official installation guide if necessary.
Linux
Perform the standard installation procedure for Linux applications. Refer to the official installation guide if necessary.
Splunk Enterprise startup
Windows
Run Windows command prompt, move to the Splunk installation folder with “cd” command and execute “splunk start” command. (For example, if Splunk was installed into default folder, use the following command: cd C:\Program Files\Splunk\bin splunk start) You can also create %SPLUNK_HOME% environment variable to simplify Splunk startup process. Refer to the official startup guide if necessary.
Linux
Execute the following command via Linux command prompt: Sudo /bin/splunk start You can also create SPLUNK_HOME environment variable to start the program with the following command: Export SPLUNK_HOME= $SPLUNK_HOME/bin/splunk start
Configuring Splunk Syslog
1. Enter Splunk GUI. To do this, open the following address via your web browser: localhost:8000. On Login page, use “admin” as login and “changeme” as password (Splunk will prompt you to set a new password).
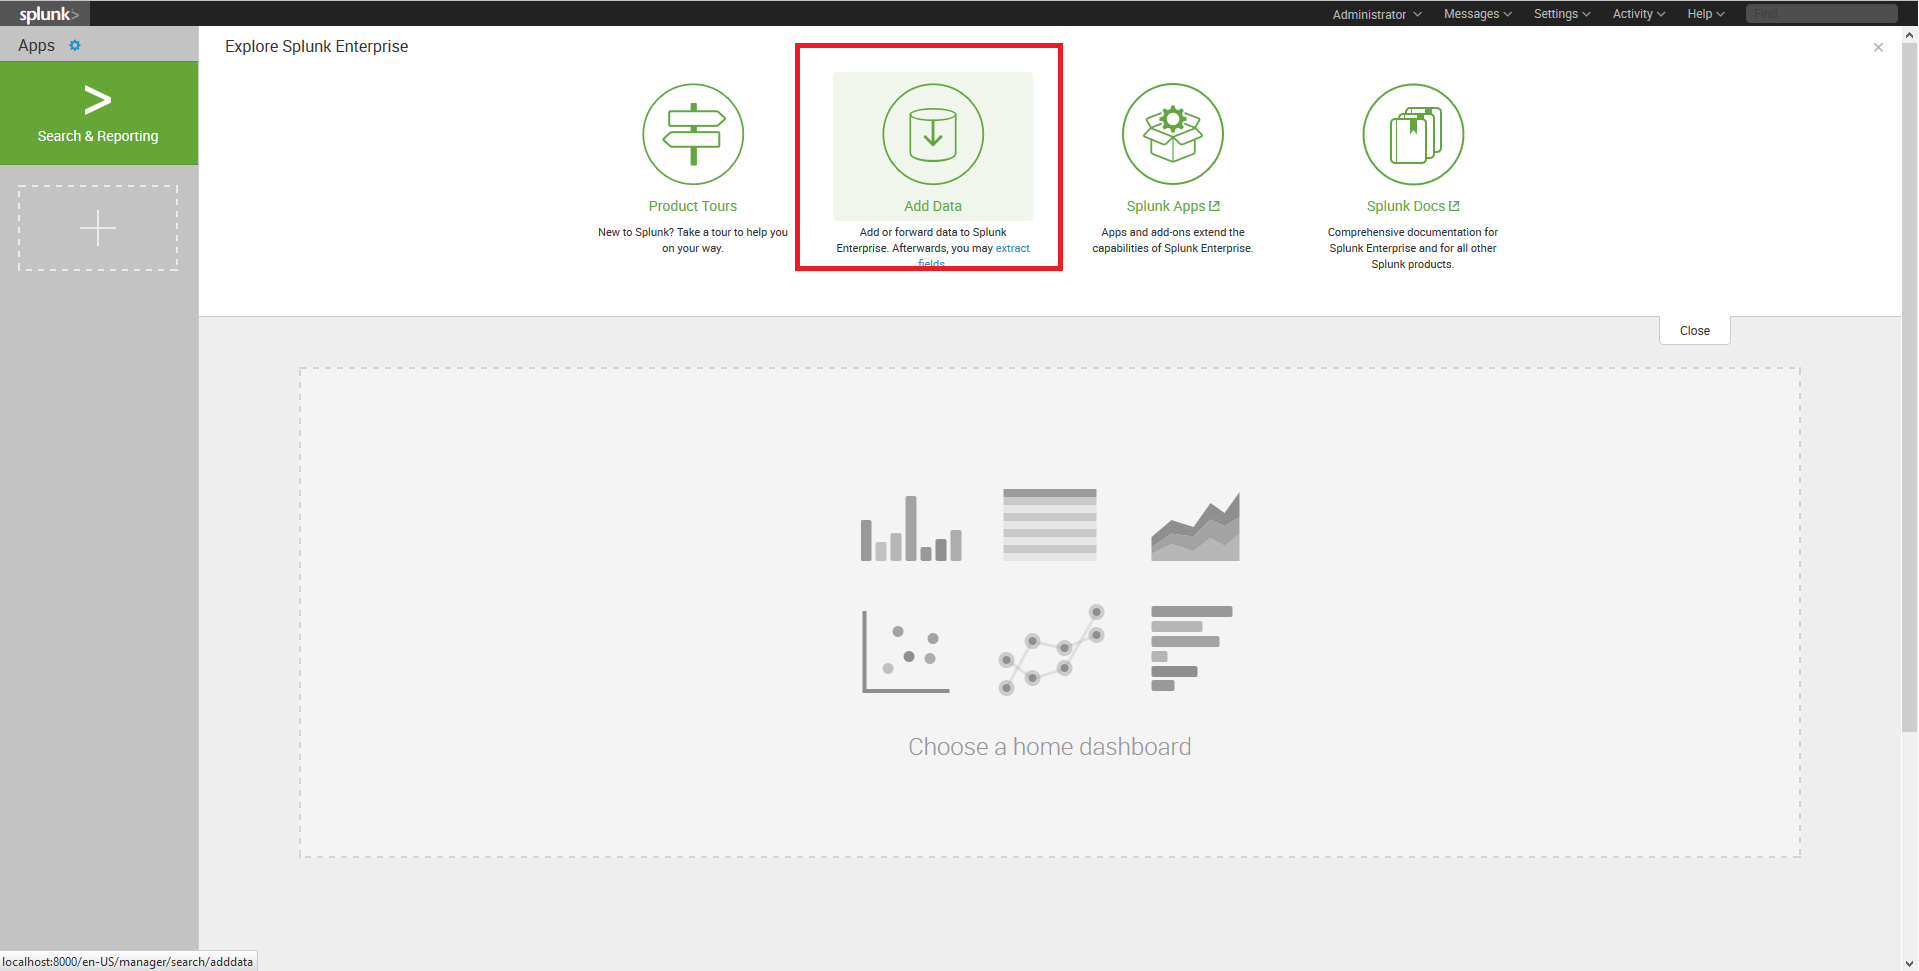
2. At GUI start page, click Add Data button.
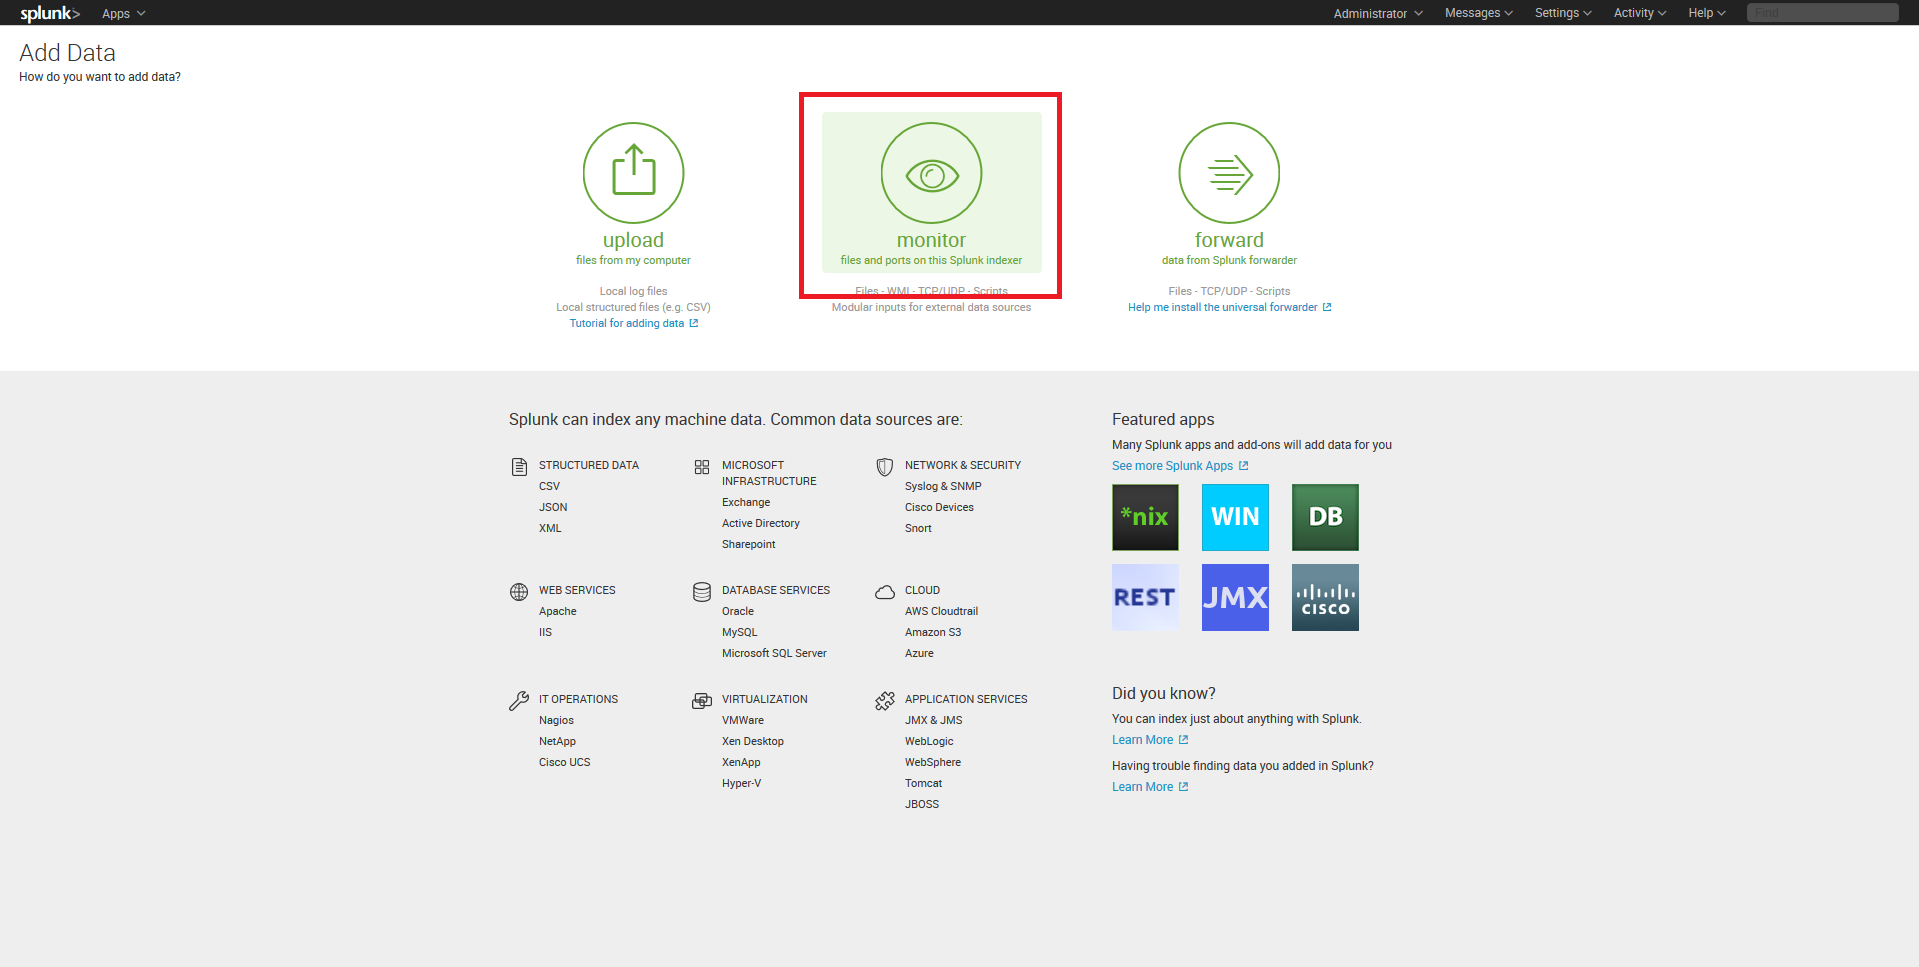
3. Then on the next page click “Monitor” for “Select Source” tab.
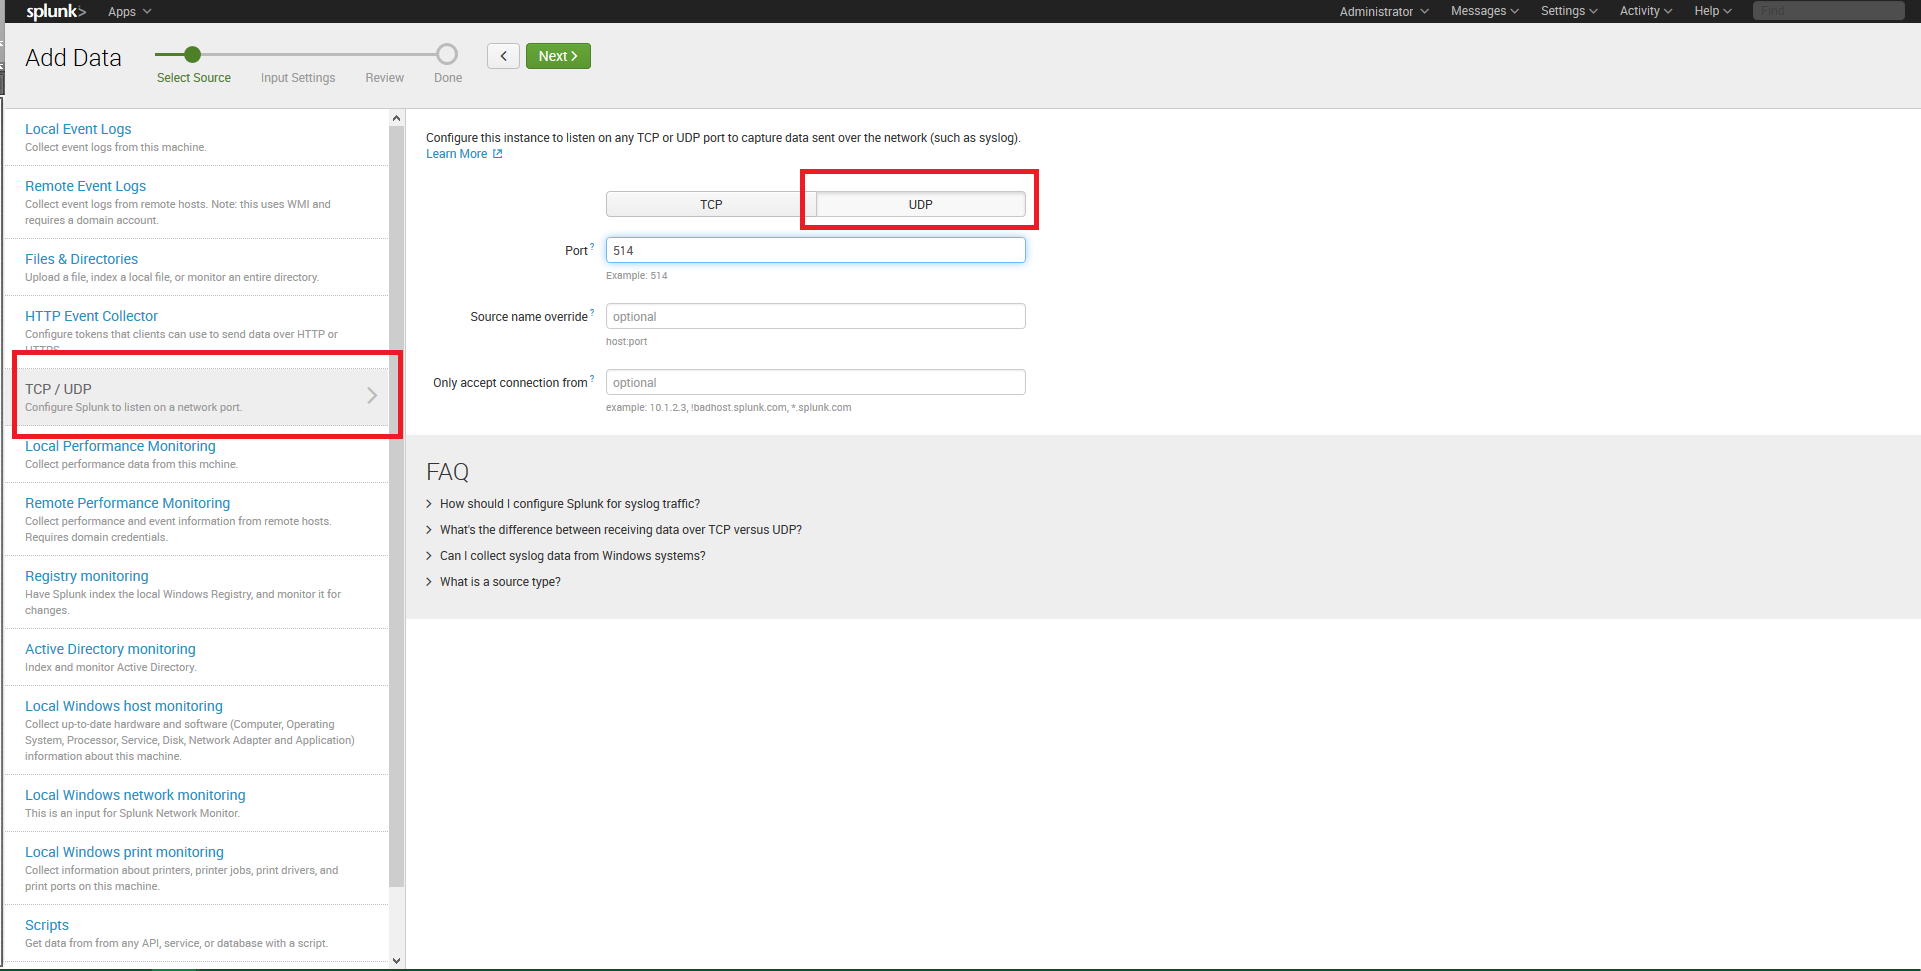
4. At “Select Source Data” tab select TCP/UDP protocol. Select UDP port by activating the corresponding switch. Specify listening port number (port 514). Leave other settings in their default state. Proceed to the next tab by pressing Next.
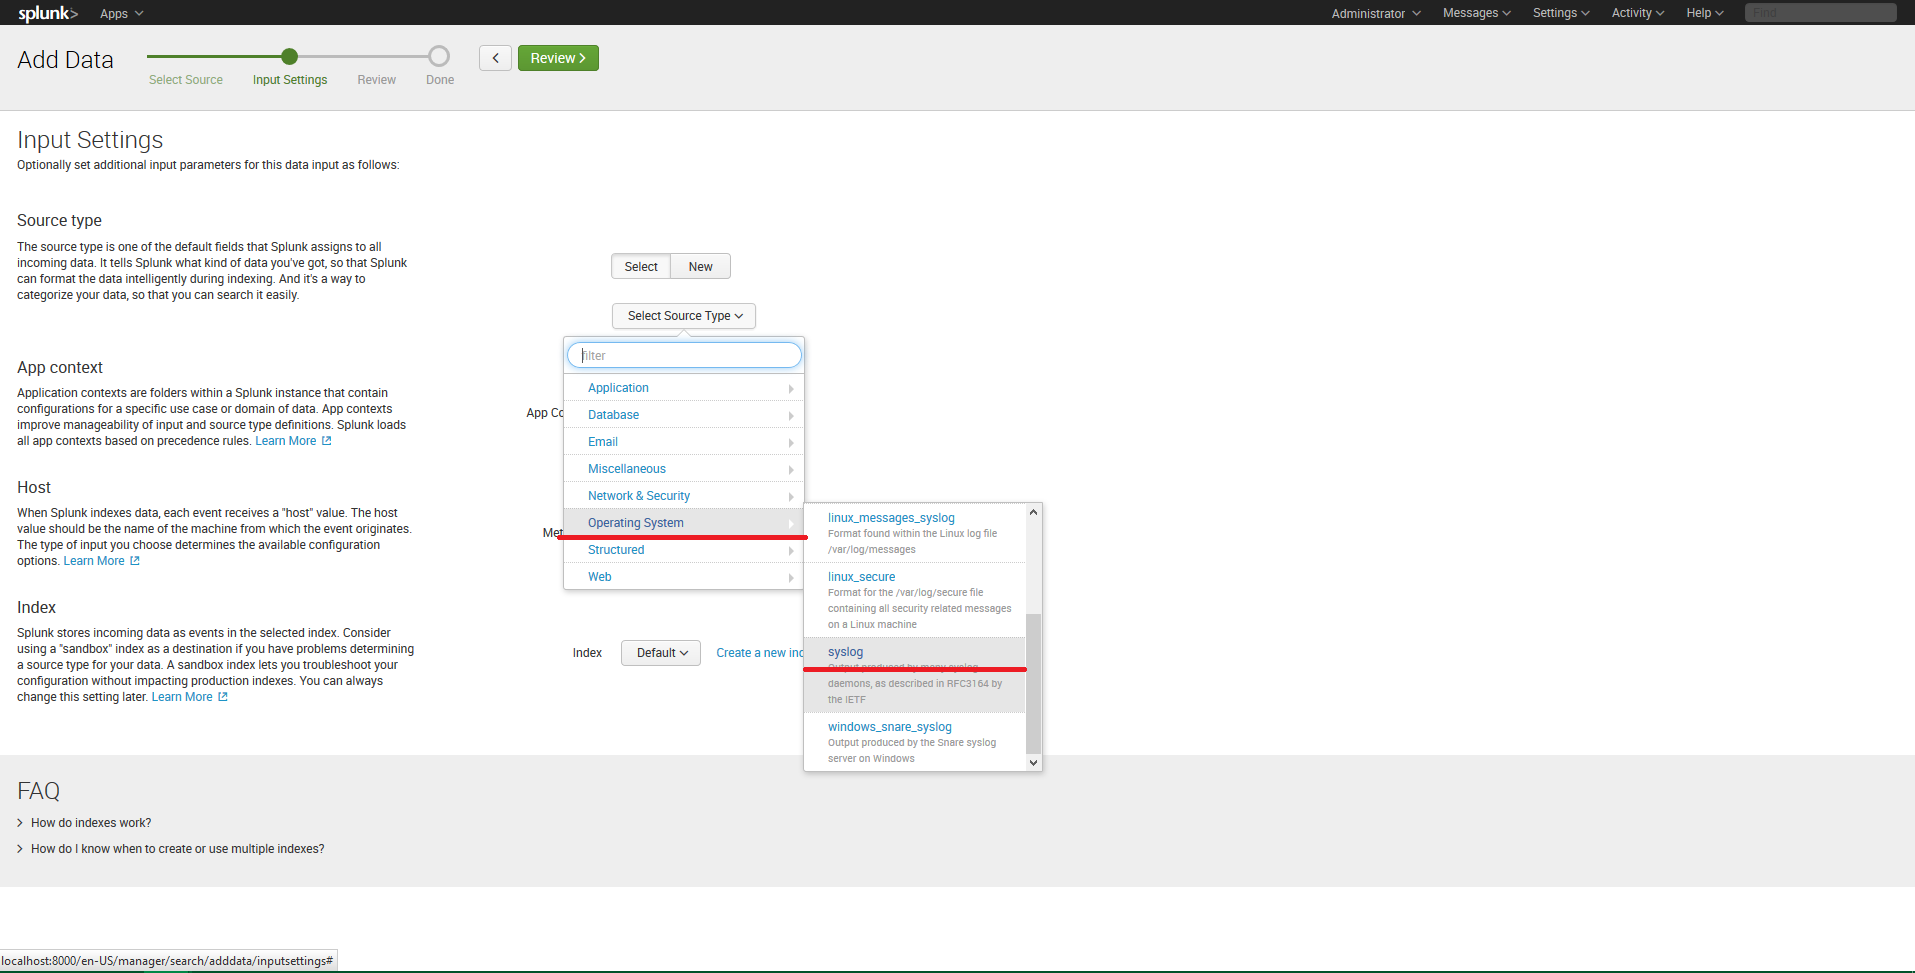
5. At “Input Settings” tab use “Select Source type” drop-down list to select Operating System-> Syslog. Click “Review” to proceed to the next step.
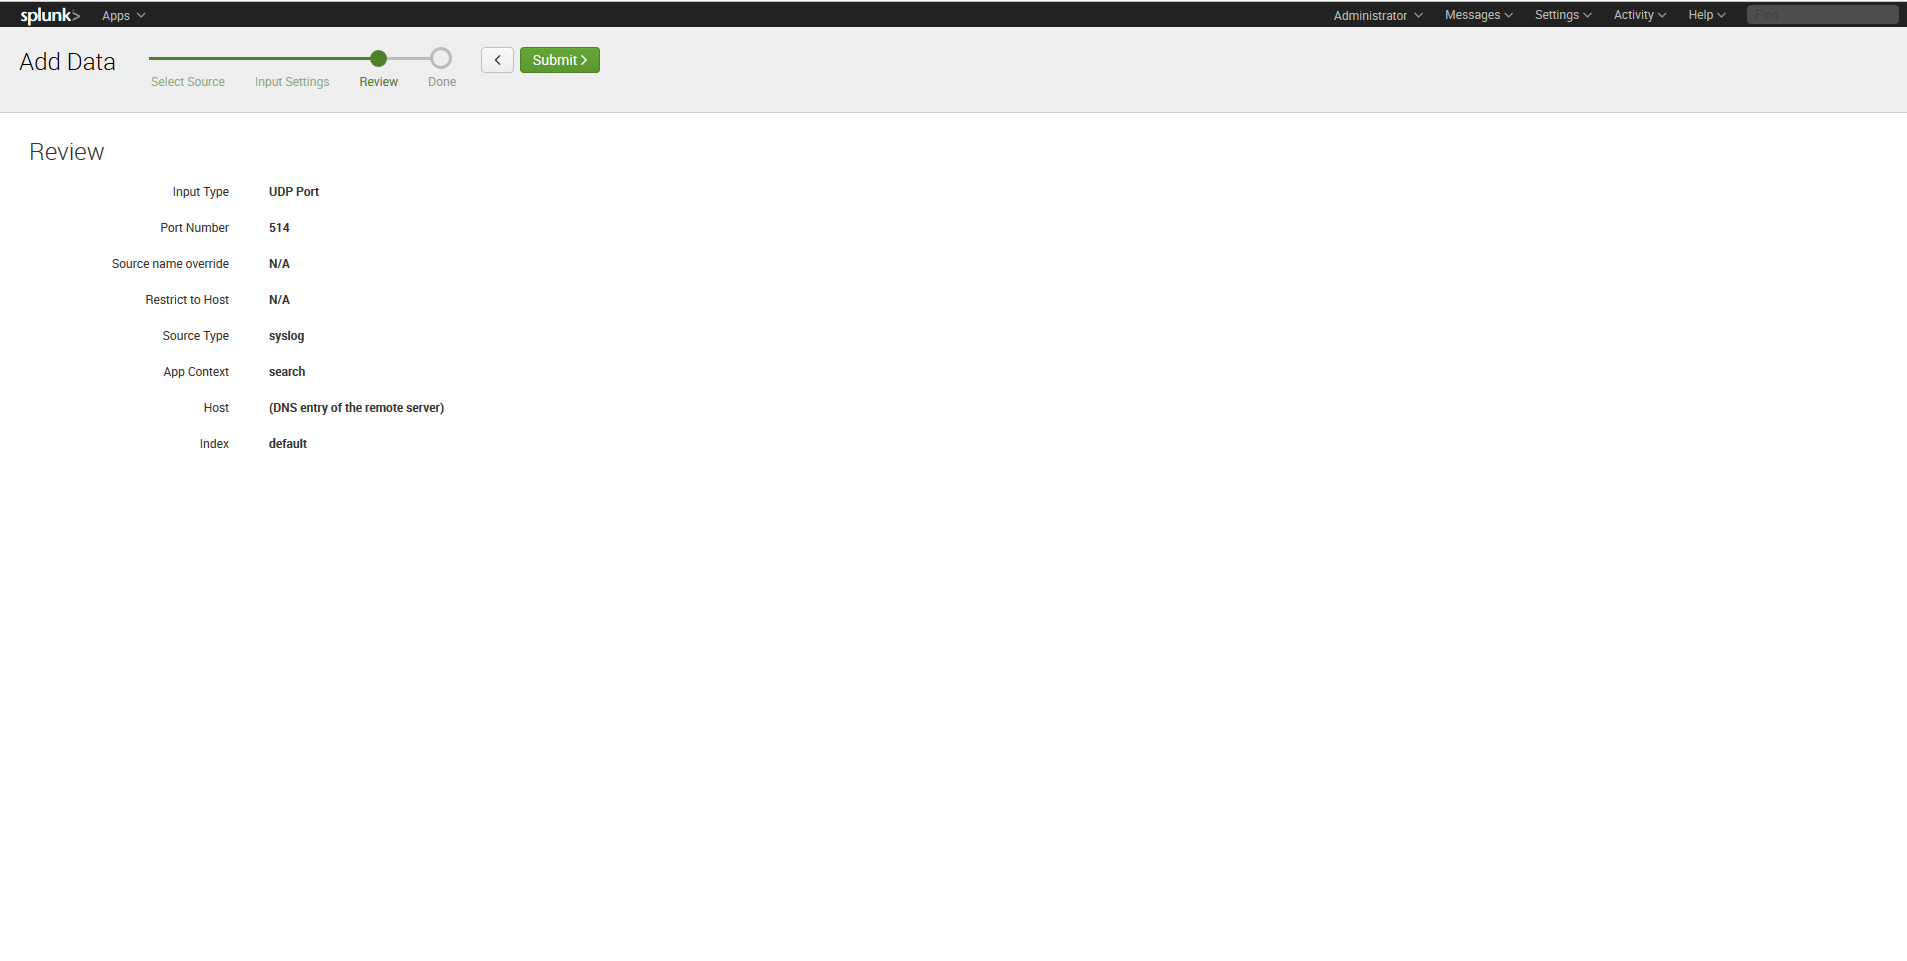
6. At “Review” tab check your settings: input type — UDP, port number — 514, source type — Syslog. Click Submit to finish the configuring.
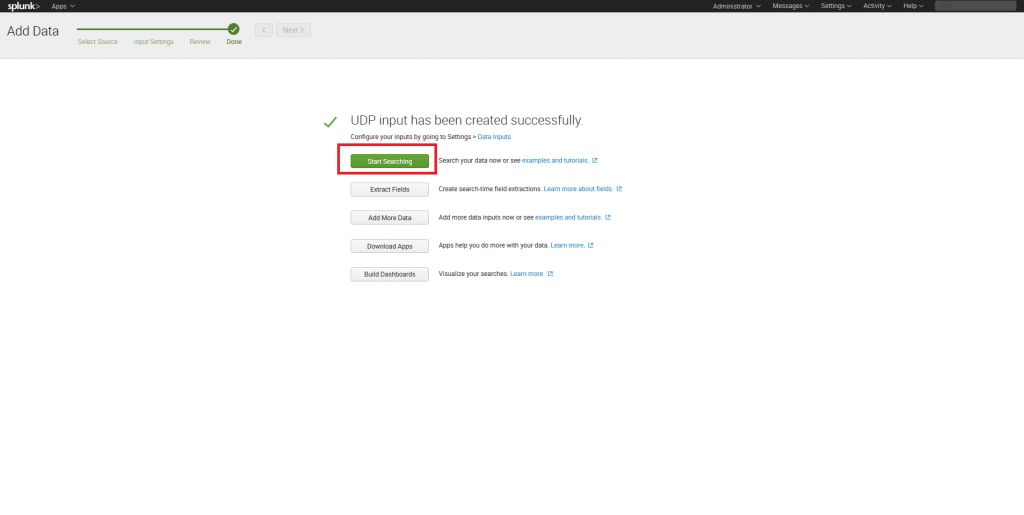
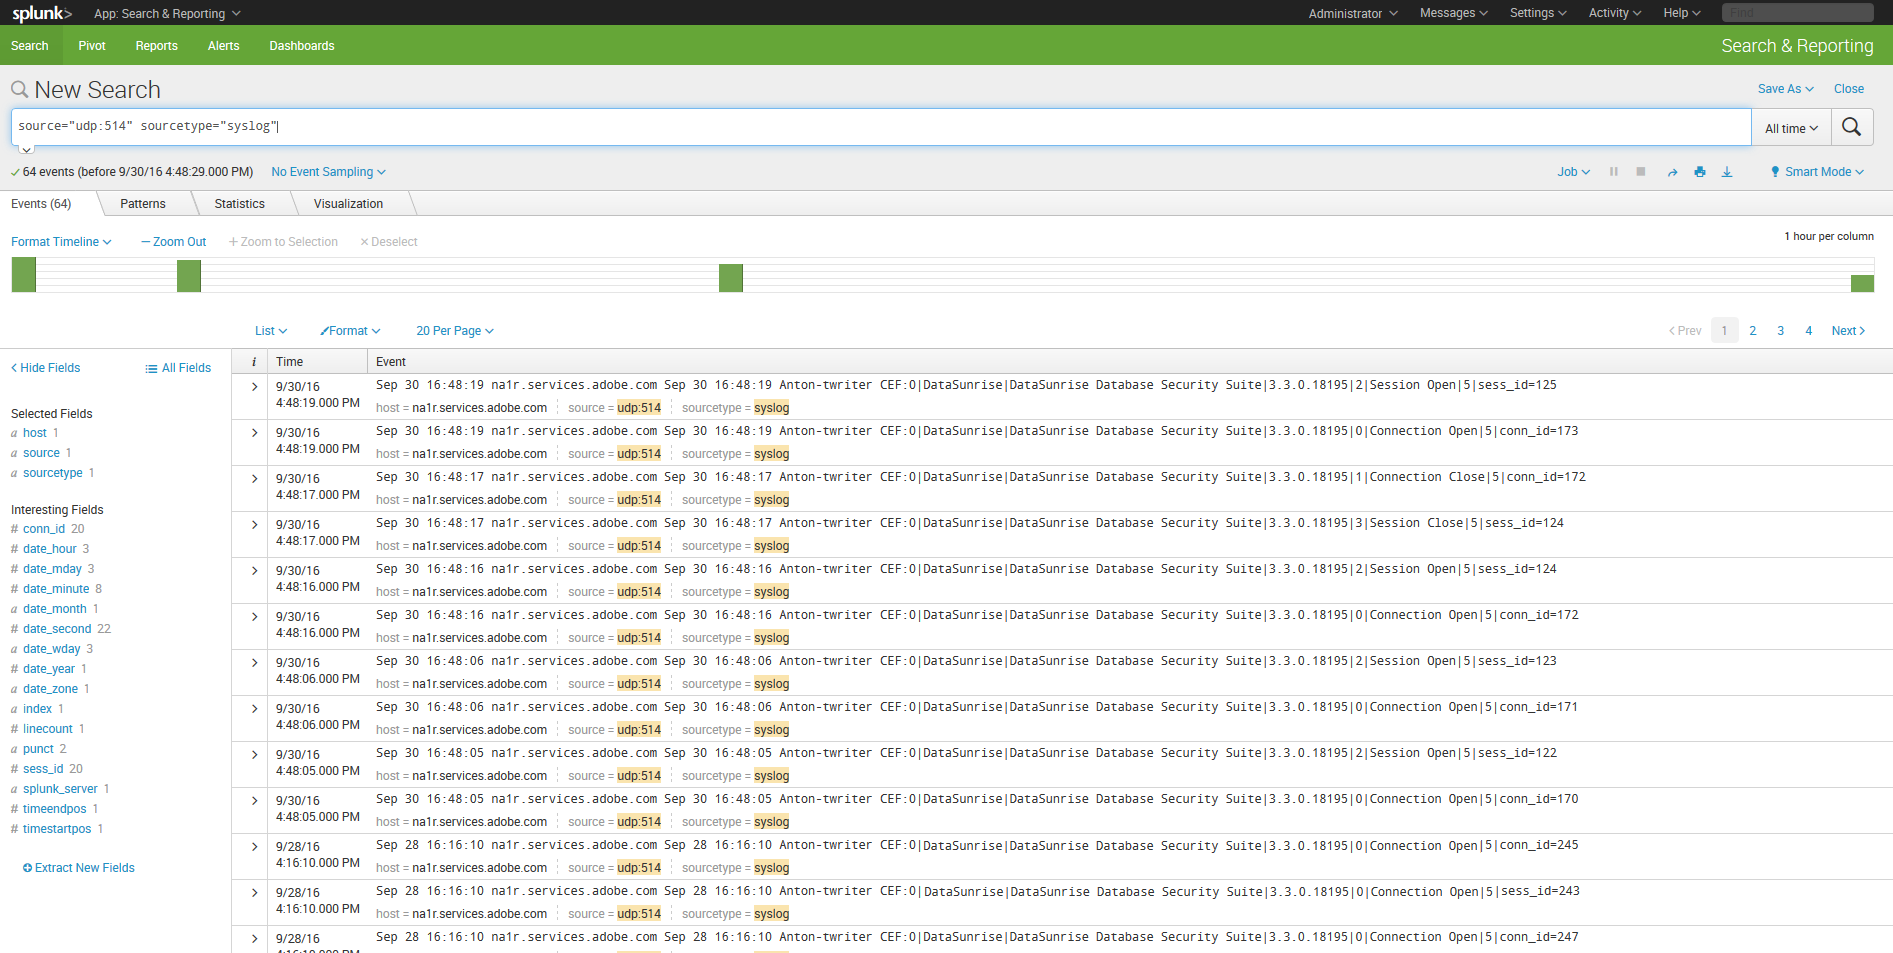
7. After the configuring is complete, click “Start Searching” to search for logs.
8. Since DataSunrise creates logs during its operation, you will not see any entries likely. That’s why you need to configure DataSunrise audit rules if you haven’t done that. Perform necessary actions to make DataSunrise create some audit logs and refresh the search page in Splunk.
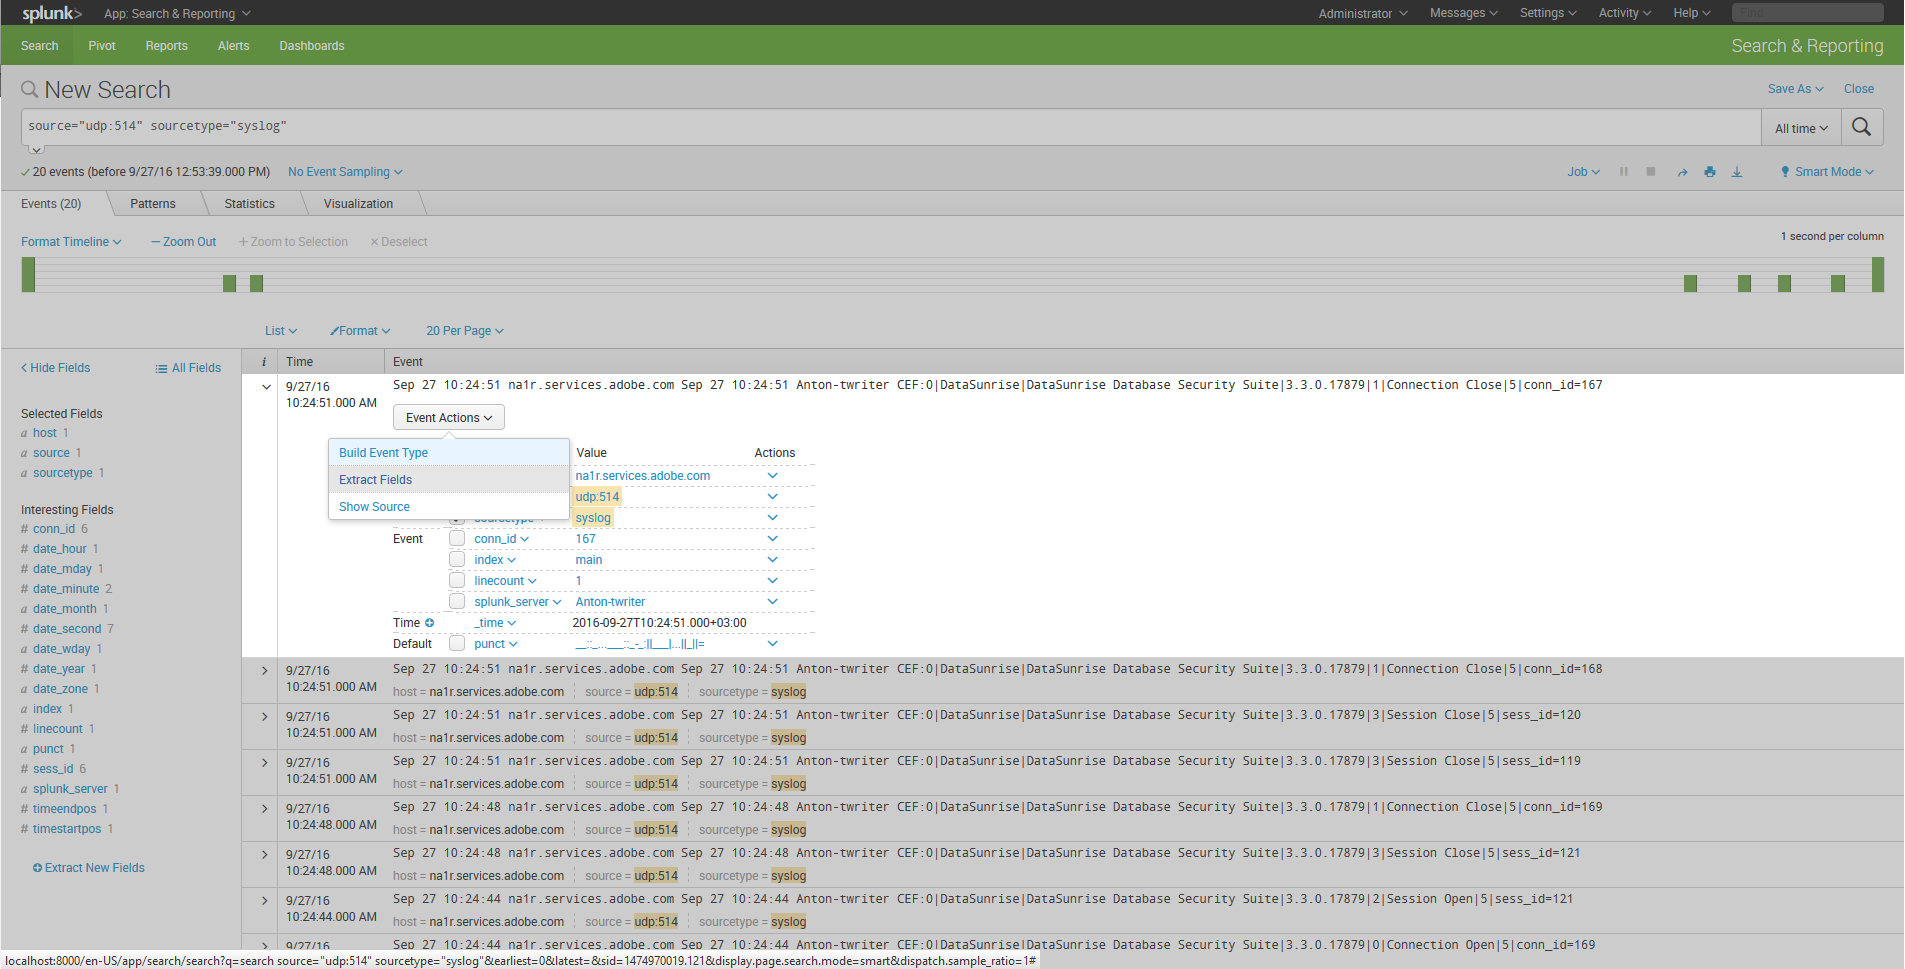
9. To view details about some event, click > in the “I” column of the required event. Then use the Event Actions drop-down list to select Extract Fields to view detailed information.
10. A new browser tab will open. You need to select am extraction method there. Regular expressions — as regular expressions or Delimiters — extracting with commas, spaces, and characters. This method is recommended for data separate with any characters (CSV files for example).
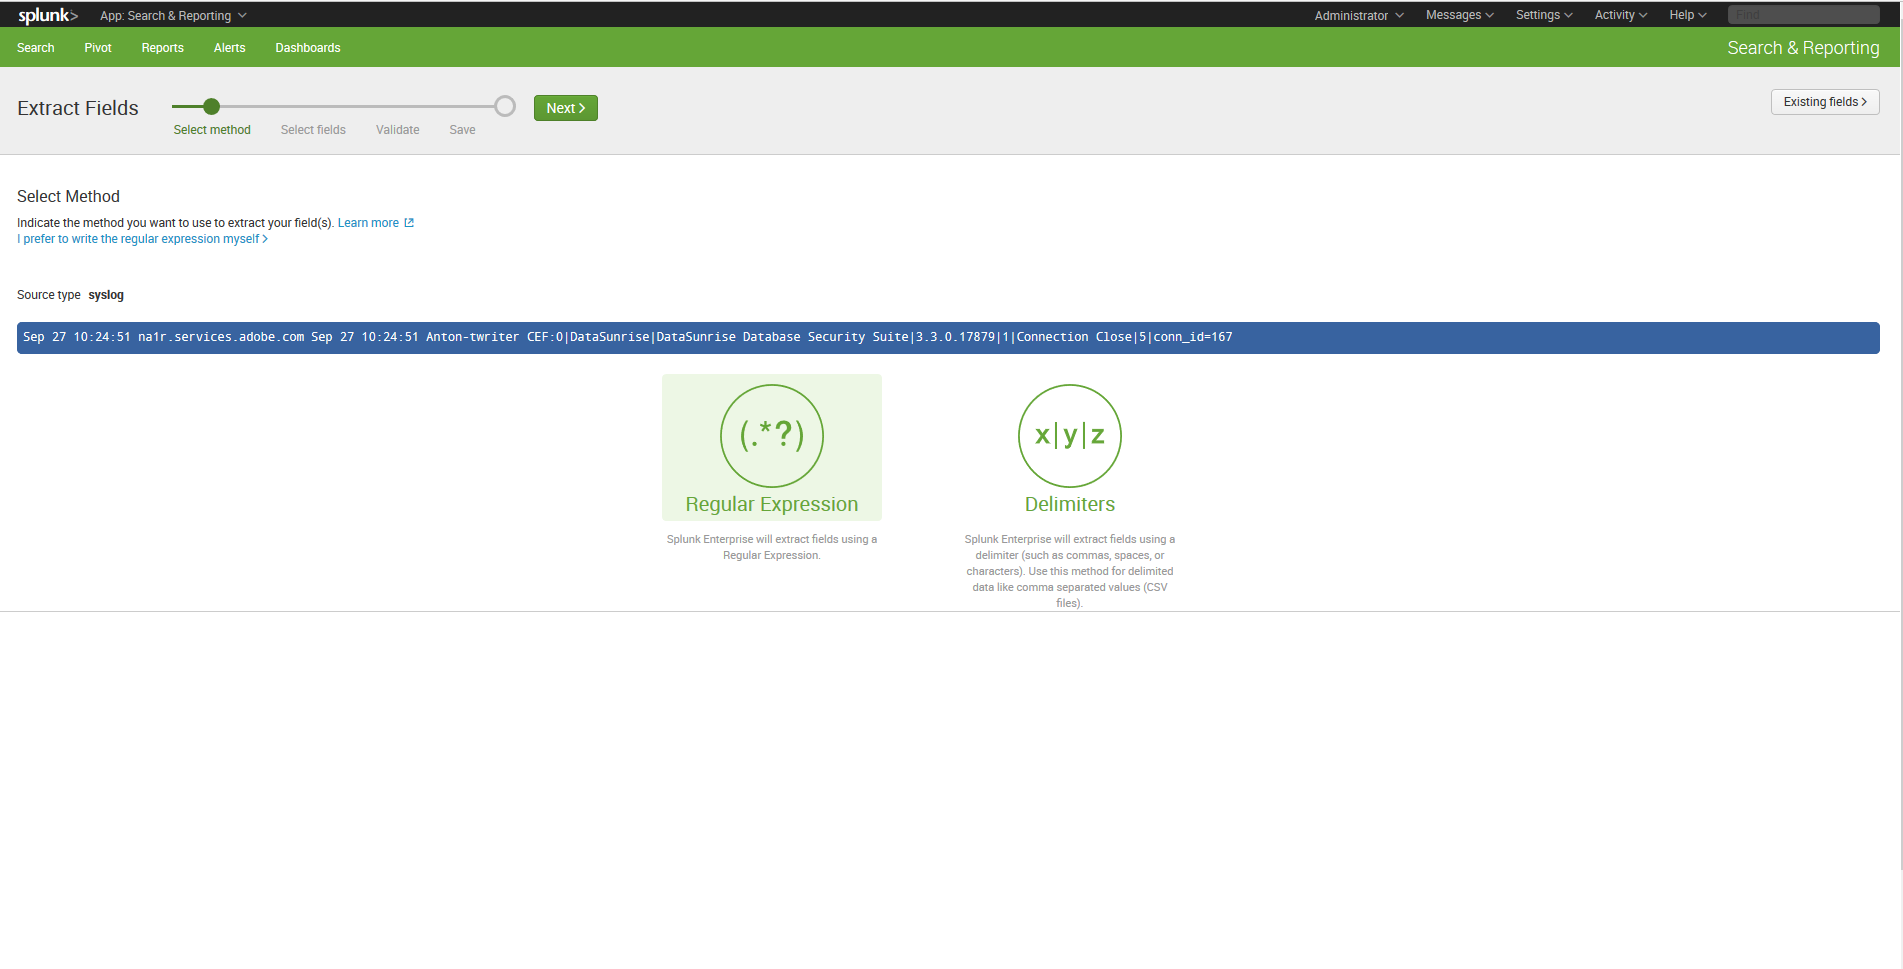
11. Having selected an appropriate method, click next to begin extraction.
DataSunrise supports all major databases and data warehouses such as Oracle, Exadata, IBM DB2, IBM Netezza, MySQL, MariaDB, Greenplum, Amazon Aurora, Amazon Redshift, Microsoft SQL Server, Azure SQL, Teradata and more. You are welcome to download a free trial if would like to install on your premises. In case you are a cloud user and run your database on Amazon AWS or Microsoft Azure you can get it from AWS market place or Azure market place.