Elasticsearch and Kibana Audit Analytics
Analytics is important for every business. Sometimes just general-purpose tools for analytics are not enough. With the growing amount of information, it is too hard to search and analyze information that businesses store.
Let’s imagine that you need to provide analytics about certain events in the database in the shortest term and you already have the tool that enables searching audit events in the database, for example MySQL or PostgreSQL. But the matter is that you are limited in time and you need to look through a ton of information for specific events. Moreover, you might want to properly visualize the content for better understanding and analysis. And here you need an additional tool. In such cases, you need to waste a lot of time, energy, and resources for search and visualization. But what if you had tools that’d make this process easier?
Here we will talk about how to analyze and visualize events from DataSunrise with Elasticsearch and Kibana.
What Are Elasticsearch and Kibana?
The main purpose of Elasticsearch is search and analysis of logs. It is one of the most popular database systems today. Elasticsearch is a huge storage where you can keep your data and search whatever and however you want. It has a huge amount of search algorithms: structured, unstructured, geo, metric, etc. With a powerful engine and interface, Elasticsearch enables you to search through a huge amount of data within a short period of time. As far as the primary use of Elasticsearch is a search through a huge amount of information thanks to clusters, it needs additional tools and instruments for analysis of data. For this purpose, you can use Kibana.
The first thing that you need to know about Kibana is that it works only with Elasticsearch search engine. Kibana is a visualization and exploration tool which you can use for log auditing, analysis, and monitoring. With this powerful tool, you can visualize and analyze the huge amount of data that you have.
Kibana is useful when you need to share information about audit logs with auditors, partners, clients, and simply for analysis. In this case information about events in the database becomes more readable and understandable. Moreover, when you create dashboards in Kibana, you can easily share them with whoever you want in different formats or just download reports. But be careful, remember that information can be sensitive and unmeant for third parties.
By itself Elasticsearch does not have any built-in security features. It was made not for the purpose of data protection. Integration with security solutions such as DataSunrise provides the opportunity to be in compliance with national and international security standards, such as SOX, HIPAA, PCI DSS, and others.
Thanks to Kibana you can pack all your audit log information in one place and create dashboards for monitoring and security purposes.
Integration with DataSunrise
DataSunrise has the capability of database audit. Thanks to it you can easily create audit rules and get information about what is happening in your databases. This feature collects and examines information about queries made to a database. With this information, you will be able to detect possible threats and potentially dangerous operations in advance. Also, you can investigate data breaches and prevent them in the future thanks to the analysis of events.
In most cases, you need visual content for analysis of auditing results. DataSunrise now has the integration with Elasticsearch and Kibana so analytics become easier and much more understandable. As far as Kibana and Elasticsearch have great mechanisms for search and visualization, it gives you a possibility for deep analysis of the data you have. As far as DataSunrise catches everything you want, you will be able to see when, where, who, and what was done in the database.
Now let’s see how it works step by step.
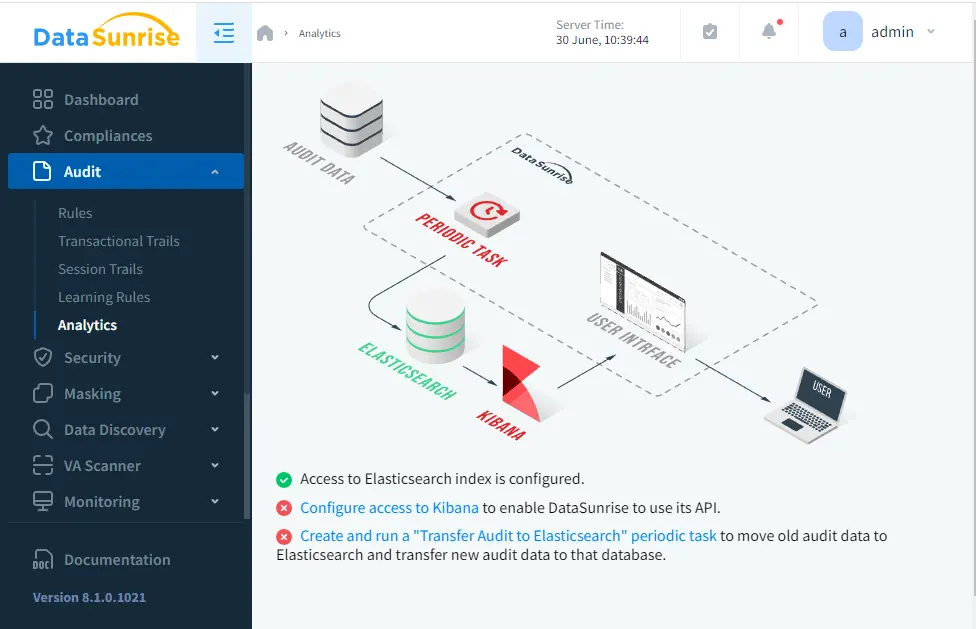
Image 1: Connection to Elasticsearch and KIbana
To see the analytics do the following steps:
- To transfer audit data to Elasticsearch you need to configure access to Elasticsearch. Choose an authentication method, hostname, and index.
- Configure integration with Kibana. Indicate the authentication method and hostname.
- Create and run a “Transfer Audit to Elasticsearch” periodic task. You need it to transfer all audit data you have and will have.
Having all these done, you will see the analytics. By default, there is information only for a current date, but you can choose a period of time. The graph depicts events in time. So you will see the time and number of queries that were executed within this period of time.
In the table below there are 4 columns:
- Begin Time
- Instance Name
- Instance Type
- Query
You can expand each row and see more detailed information as a table or save it as JSON.
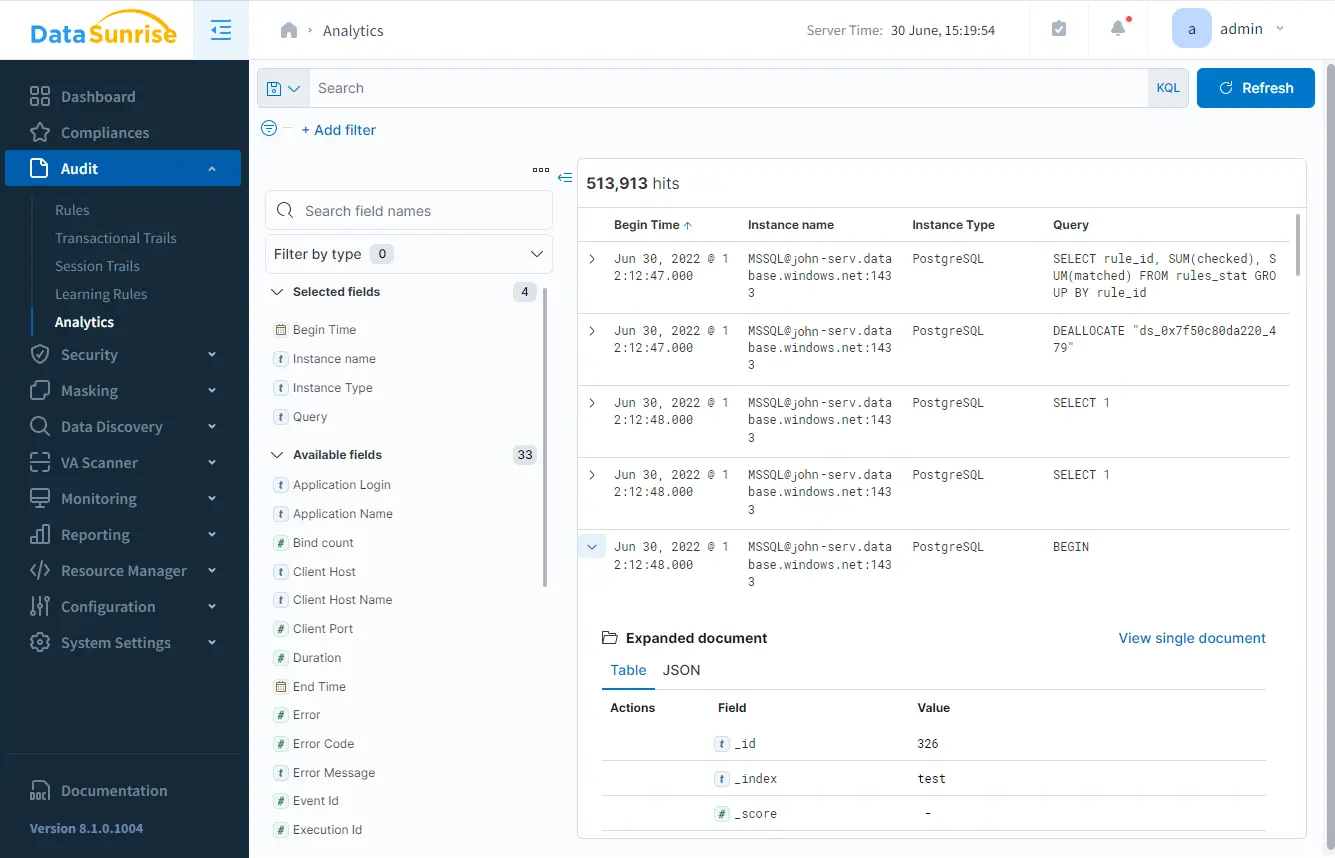
Image 2: Kibana Interface in DataSunrise
In the search area, you can look through the types of events. It gives results only for a current query, so it is faster and more informative.
On the left sidebar, you can see filters, selected and available. You can see the top 5 values for each filter and their percentage.
When you choose a filter, you will get information illustrated by different types of graphs. On the right sidebar, you can create a parity plot, where you can graphically compare two different filters. With this information, your analytics become more vivid and understandable.
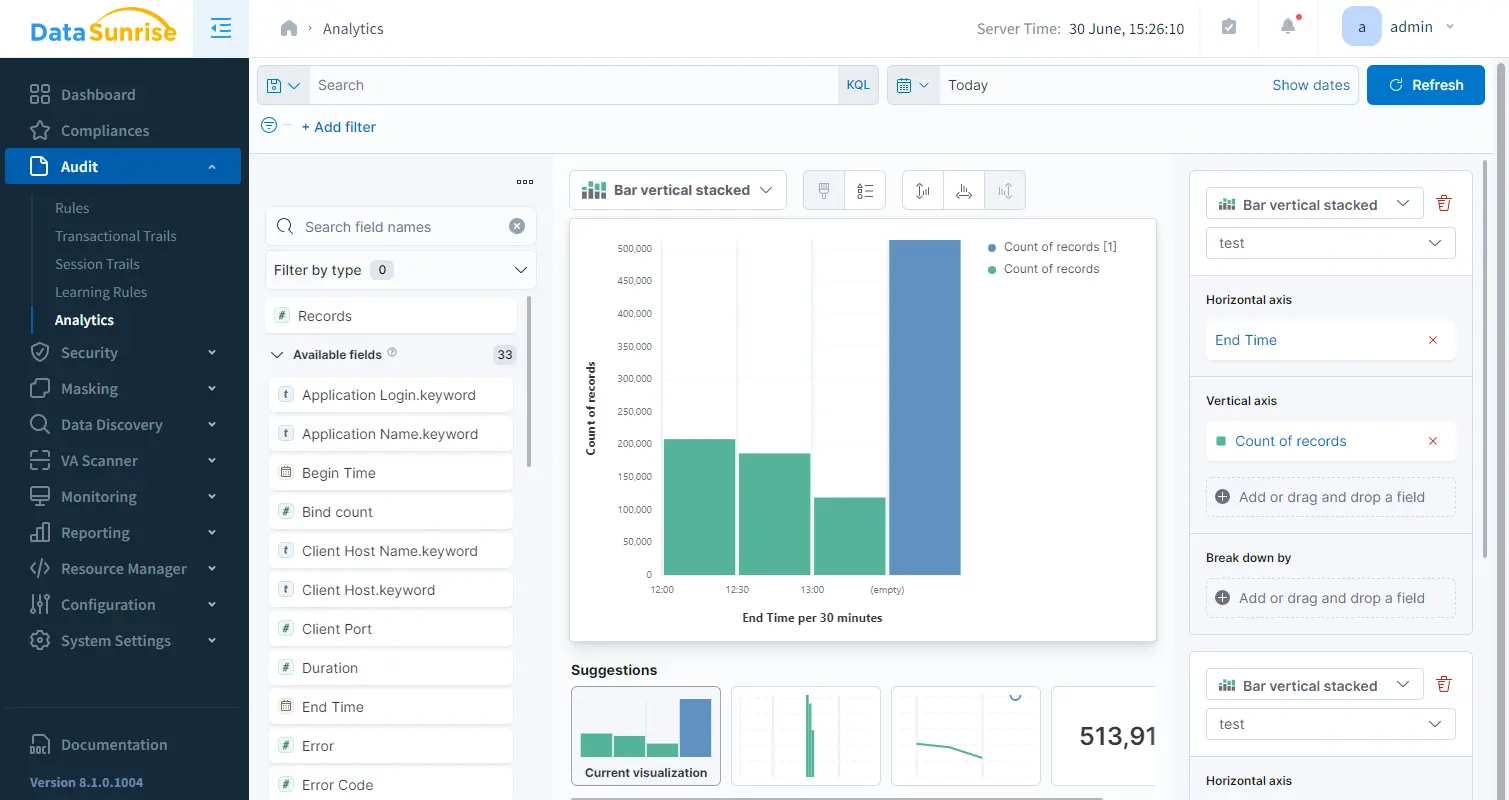
Image 3: Audit Analytics
As you see, the configuration process is quite simple. DataSunrise together with Elasticsearch and Kibana provides a powerful unit for analysis and investigation of events.
An automatically configured diagram shows all events in a database by time and number. Visualization is an important part of every analysis as far as thanks to it information is perceived better. Moreover, the search works faster and easier, so you do not need to wait or build your own filters. Try our new audit analysis capability with Elasticsearch and Kibana.