Reports in DataSunrise: Crucial System for Enhanced Database Security
DataSunrise provides multi-layered protection for your databases and therefore processes a vast amount of operational and security data. Audit rules, security policies, and multiple types of Masking rules work together continuously — and with so many components, it can be challenging to maintain full visibility and extract meaningful insights quickly.
To simplify monitoring and analysis, DataSunrise offers a customizable reporting tool that allows you to export detailed reports in multiple formats, including CSV, PDF, and JSON. These reports consolidate information about your databases, users, and activities into a structured and visual format. Depending on your priorities, reports can focus on performance, security, or compliance metrics.
The content of each report depends on two main settings: the report type — which determines the DataSunrise functionality being analyzed — and the filters that refine which data is included. For instance, if you want to understand how users interact with your databases, you can select the Audit report type and use the Data filter field to narrow results by user, query type, or time period.
In DataSunrise, audited events are processed and stored as transactional trails — chronological logs that capture every access and modification within the database, ensuring complete visibility for forensic analysis, compliance, and anomaly detection.
With transactional trails included in your reports, you can track not only who accessed which data but also how it was changed, when, and under what policy conditions. This comprehensive visibility strengthens regulatory compliance (such as GDPR, HIPAA, or SOX) and enables proactive incident investigation without manual data correlation.
How to Create a Report
In order to create a reports in DataSunrise, you need to navigate to Report Gen in the Reports section of the Web Console. After clicking the New button, the form for creating a report will open.
The creation of a report begins with the Basic Info section, where you need to name your report, select a server the report will be generated on (remote or local), select report format (CSV, PDF or JSON) and also specify the type of report.
Currently available report types:
- Audit – reports on events (transactional trails) captured by the Data Audit functionality
- Security – reports on events blocked by the Data Security functionality
- Masking – reports on database columns that were masked by the Data Masking functionality
- Session Report – reports on unsuccessful database authentication attempts
- System Events – reports on system events
- Operation Errors – reports on SQL errors
- Instance Status Report – reports on Proxy/Instance state
- Direct Session Report – reports on connections (sessions) established between the target database and client applications directly bypassing DataSunrise proxies.
Further sections depend on the type of report you have selected. In them, you can for example specify the SQL queries you want to receive information about or duration of database sessions.
The rest of the sections are common for all types of reports: Frequency of Generation, Export Parameters, and Remove Results Older Than. In the first section, you can select the frequency of generating reports by time, in the second you can set a limit length of requests and send a report, and the third section enables you to automatically delete results older than the selected period (1 week, 1 month, etc.).
Reports examples
Let’s look at the examples of the principles of creating and working with DataSunrise reports
Case 1: Audit Report
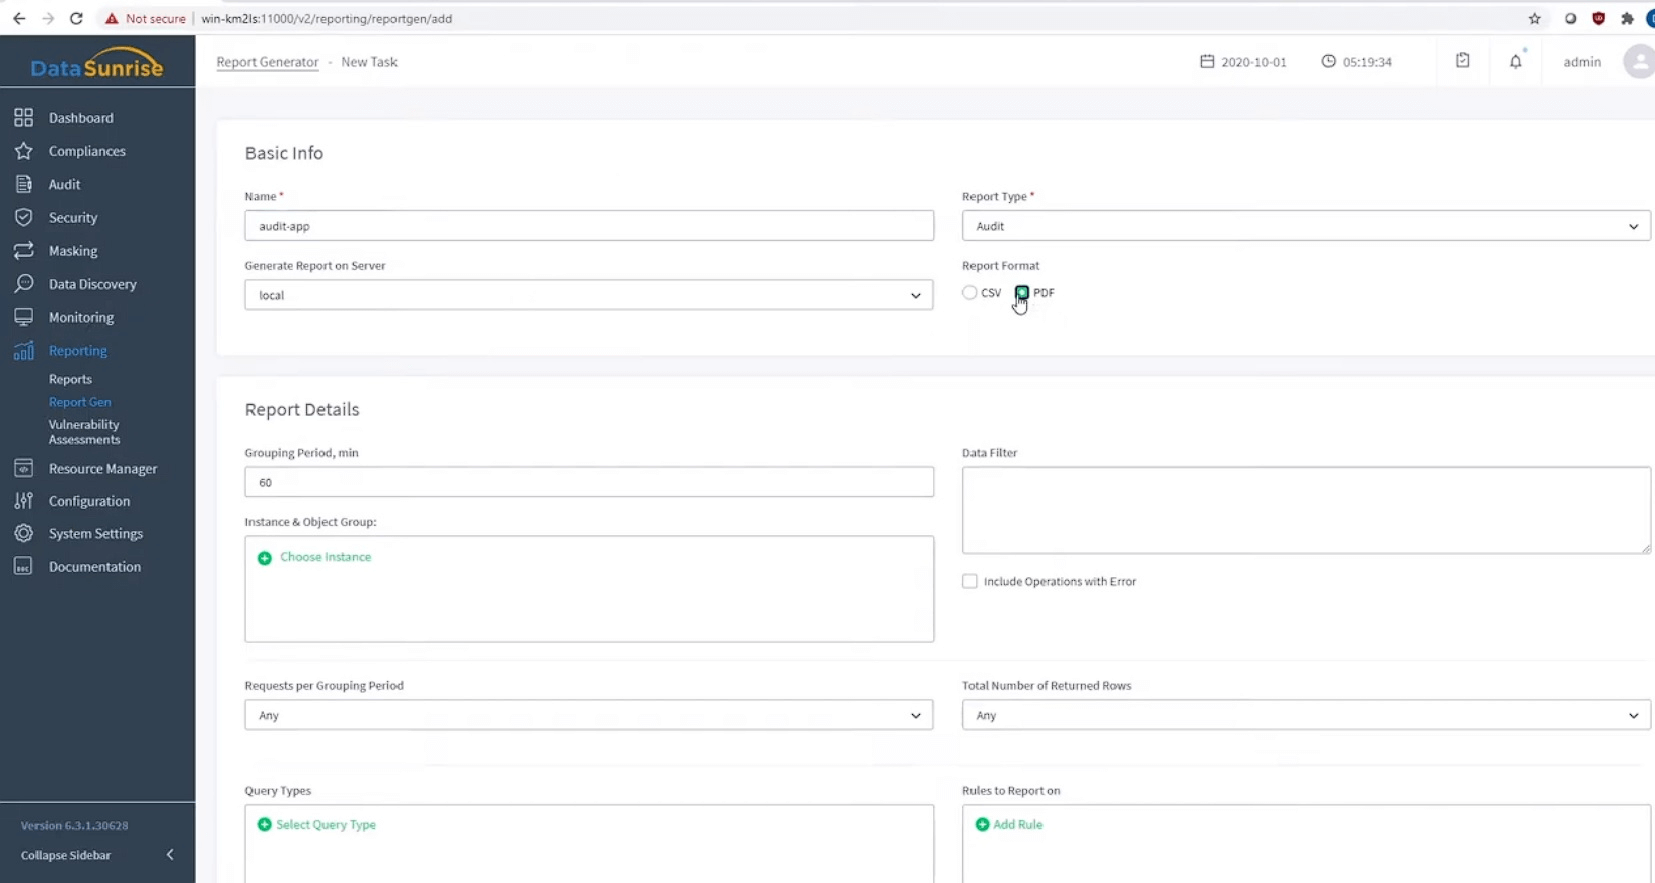
We start creating a report from the very first section, Basic info. We input some name (in our case it’s “audit-app”), select the server, the type of the report, and the report format (PDF here).
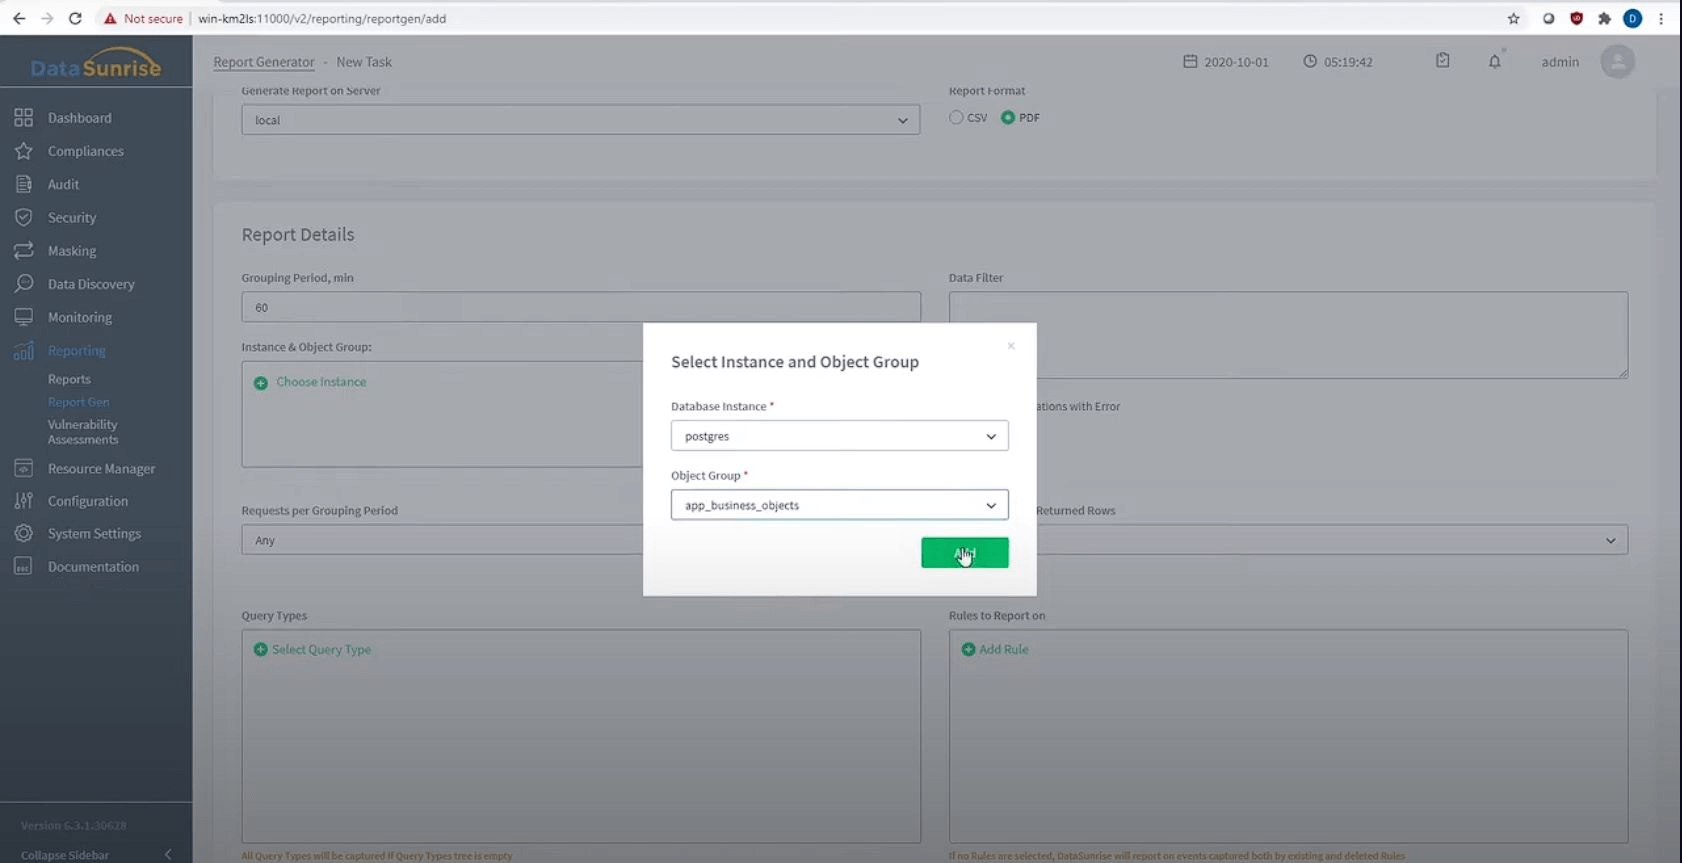
Further, in the Report Details section, we indicate the database instance and the group of database objects we have previously arranged resources into for auditing.
Below, in the Query types and Rules to report on fields, we can select queries and Rules, information about which should be displayed in our report. We will not dwell on any specific queries and Rules here.
The last stage of creating a report is setting the generation frequency. For this case, we select Manual.
To save the report, click Save.
To start report generation, you need to navigate to Reports, select the required report, and click Start in the Actions menu. The creation of the report will begin.
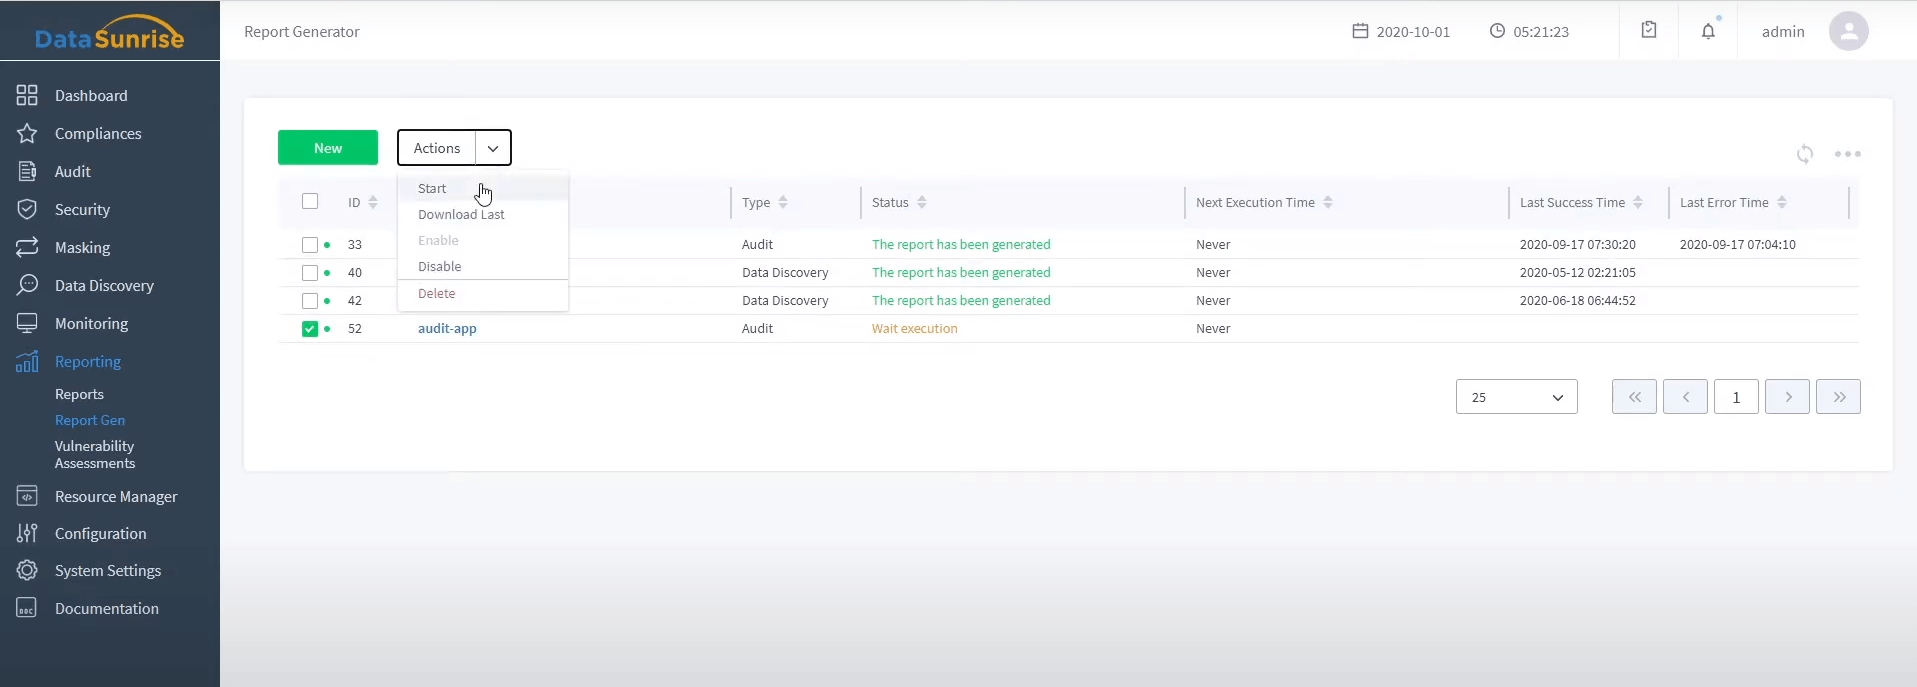
The message “Report generation in progress” means that the report generation is configured correctly and within a few seconds it will be generated. Otherwise, a detailed error message will be displayed.
You can download a ready-made report in the lowest section, Reports, as well as by selecting the “Load last” item in the “Actions” menu.
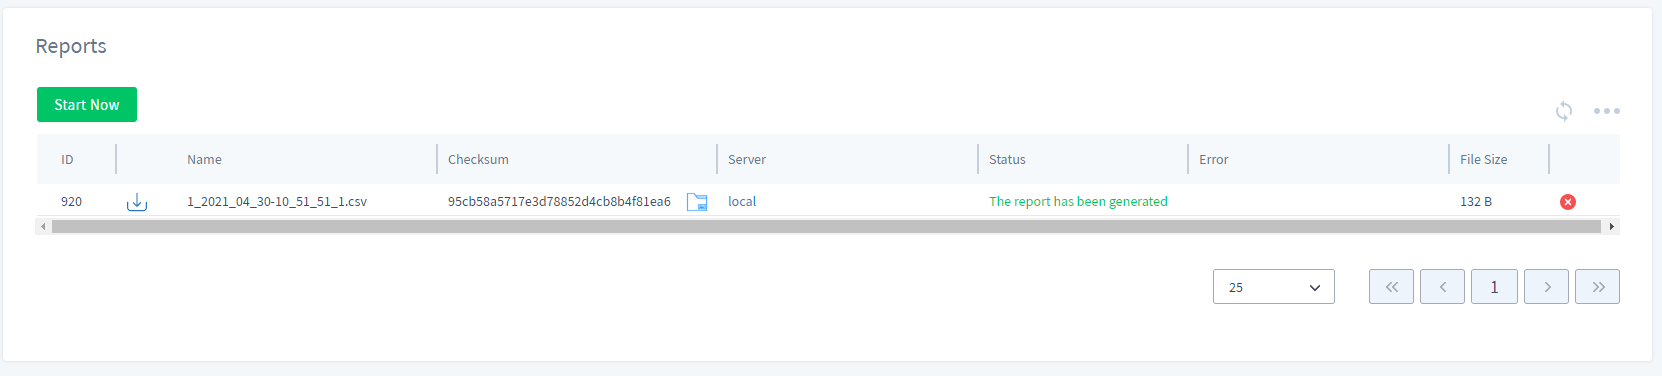
This is how a report generated according to the settings above looks like:
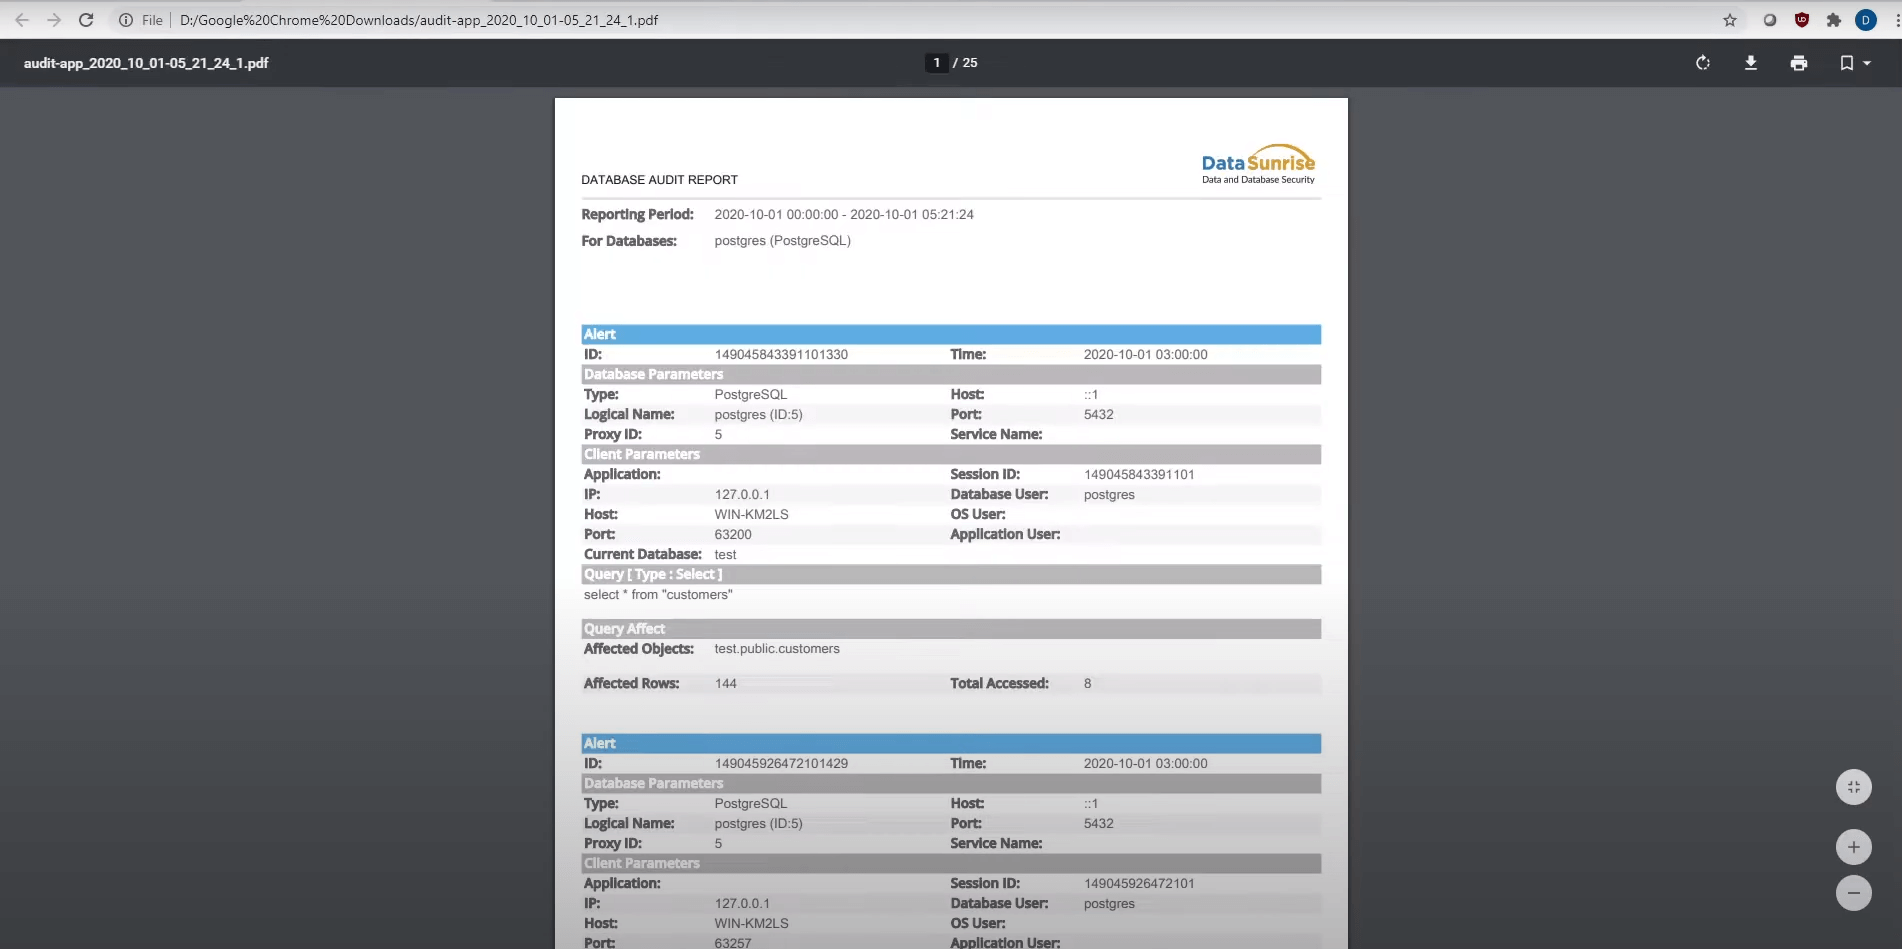
Most of the information in the report is about the postgres user activity, which is likely information about the application’s data usage. Let’s dive deeper and reconfigure the report generation Rule to know which user interacted with the data.
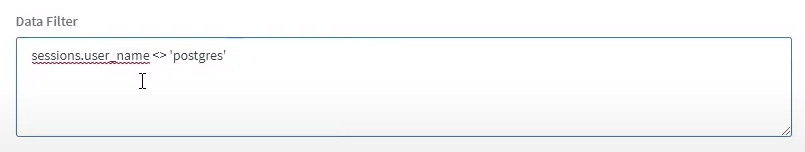
To do this, we go back to the report generation form and exclude all information on the postgres user from it. To do this, in the Data Filter field, we specify the session.username filter, which you can find in chapter 11.4 of the User Guide.
Filters are set according to the Rules of SQL syntax. The filter below specifies a condition under which the names of all users except postgres should be displayed in the report.
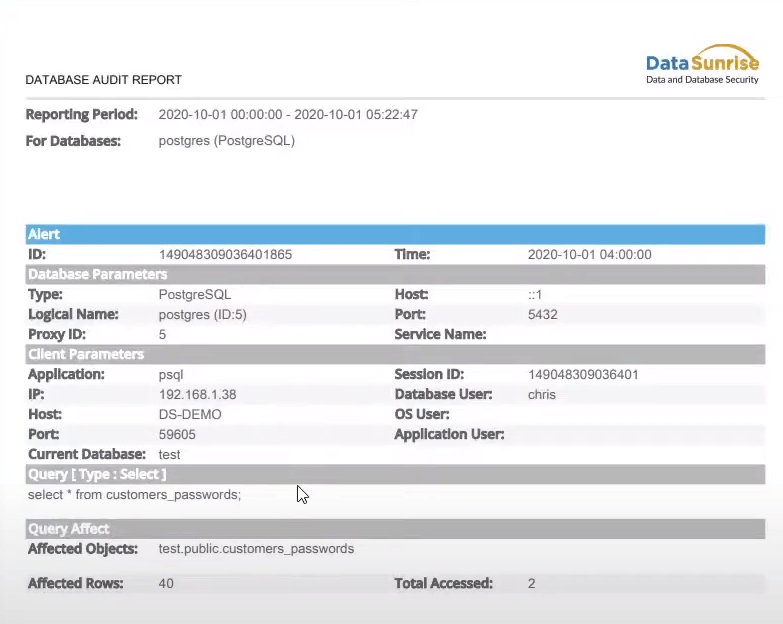
After creation, the report file weights less, it is also much easier to find information about the users that interacted with the database.
Case 2: Extracting data about manipulations with user privileges
Now let’s look at an example report, containing information about manipulating privileges and creating/deleting new users.
This rule will not differ much from the one created above: you also need to set a name, select a database instance, server, and report type. It is important not to forget to specify the filter session.user_name <> ‘postgres’ to see the result only for real users.
The differences are present in the Report Details section, in the Query Actions menu. In this menu, we select only those operators we are interested in. These are all the statements associated with the Users Modify as well as the GRANT statement. For convenience, a search function is implemented in the menu.
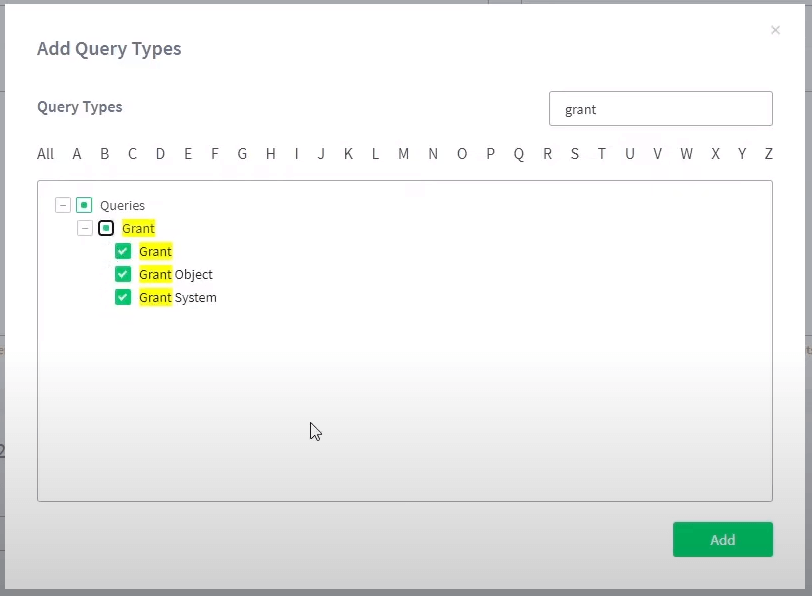
All selected operators are displayed in the Query Types window and easily accessible.
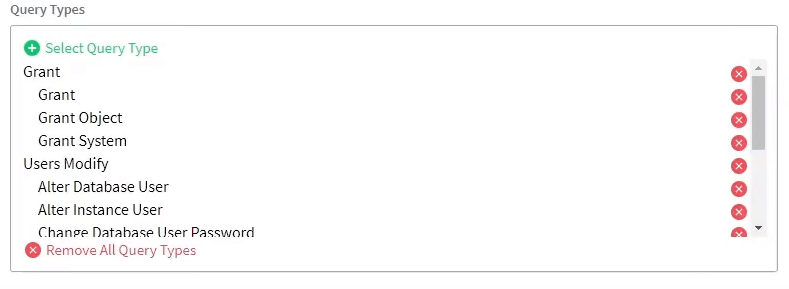
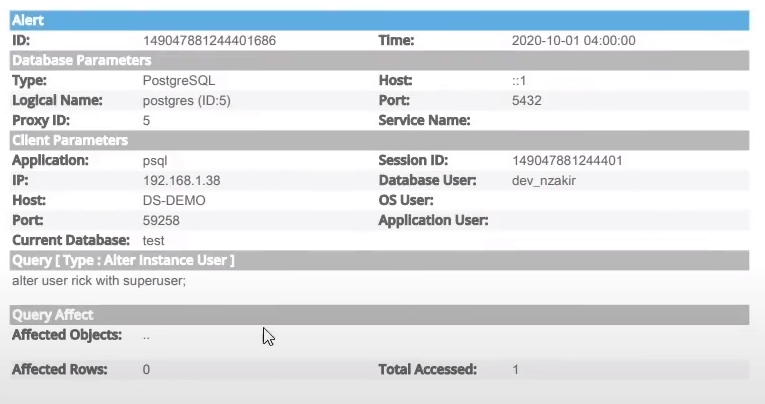
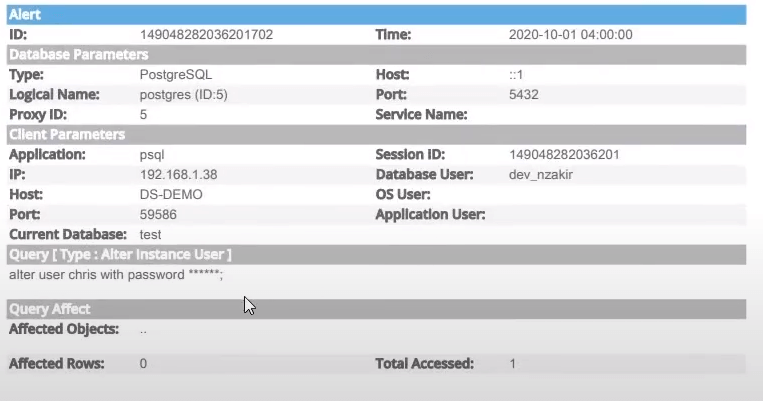
The generated report contains all the information we need: who and when created new users, granted them privileges or changed passwords.
Conclusion
With a flexible system of customizable reports in DataSunrise, you no longer need to manually monitor information about the protection levels of your databases. Customize the generation of reports and receive information at the time you need it in a convenient format.