ClickHouse Database Activity History
Tracking ClickHouse database activity history is not optional anymore — it’s the backbone of accountability in a system built for extreme throughput, massive clustering, and real-time analytics. Compliance frameworks like GDPR, SOX, PCI DSS, and HIPAA demand more than raw logs scattered across nodes; they require chronological visibility into every interaction with sensitive data, mapped to identities, enriched with context, and preserved in a tamper-resistant form.
While ClickHouse exposes a wealth of system-level telemetry through query logs, part logs, and server-level events, these native streams suffer the classic distributed-system problem: fragmentation. No single source delivers a complete story of who did what, where, when, and why across the cluster.
This is where DataSunrise redefines the ClickHouse activity-history model — aggregating native signals, correlating them in real time, and presenting an audit-grade timeline aligned with security and compliance requirements.
Importance of Database Activity History
ClickHouse environments process massive amounts of analytical traffic that often include personal, financial, operational, or regulated datasets. Because workloads scale horizontally across distributed nodes, understanding what actually happens inside ClickHouse requires more than basic logging. A structured activity history enables organizations to:
- Prove compliance with GDPR, HIPAA, PCI DSS, and SOX through complete event lineage tied to user identities, in line with broader data compliance regulations.
- Reconstruct incidents, including insider misuse, destructive schema changes, accidental deletions, or unauthorized access, supporting the aim of a DB audit trail.
- Detect anomalies that raw logs cannot contextualize — such as off-hours access, privilege escalation attempts, or abnormal data scans — using techniques similar to user behavior analysis.
- Trace data lineage during audits or investigations, often combined with data discovery to locate sensitive objects.
- Connect operational events (mutations, merges, performance regressions) back to responsible users or applications while preserving strong database security.
- Maintain accountability within multi-tenant or multi-team ClickHouse clusters, complementing role-based access control models.
Without a centralized and enriched activity history, organizations remain blind to critical operational and security patterns and weaken their overall data security.
Native ClickHouse Activity History Features
ClickHouse provides several system tables and log sources that form the backbone of its native activity-history model. These components reveal what occurred inside the engine, though not always why or who initiated it. Raw engine telemetry also lacks the structure provided by dedicated audit logs.
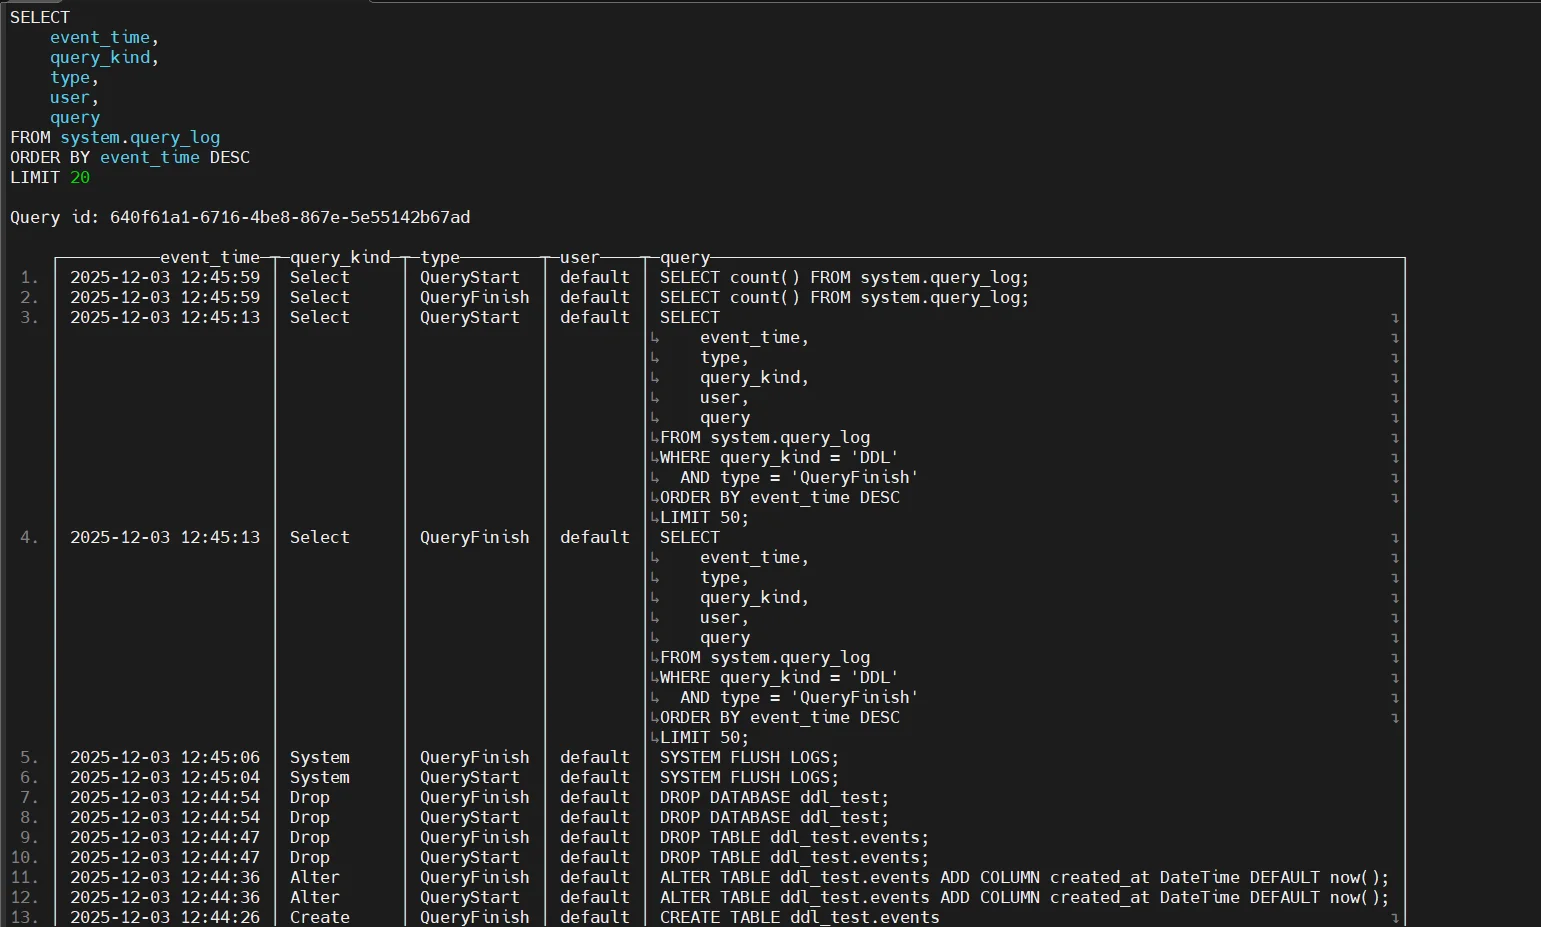
1. system.query_log
This is the primary source of SQL activity information in ClickHouse. It records everything from simple SELECT statements to distributed INSERT queries, making it essential for understanding user behavior, workload patterns, and operational anomalies. Because ClickHouse executes queries in a highly parallel manner, system.query_log helps trace the lifecycle of each request and measure its performance characteristics.
It is especially useful for:
- auditing which users executed which queries, from which hosts
- identifying long-running or resource-intensive operations
- troubleshooting unexpected read/write spikes
- reconstructing query workloads during incident investigations
Captures SQL-level telemetry:
- query text & normalized hash
- user & roles
- client host
- read/write statistics
- execution timing
- memory usage
- error metadata
2. system.part_log
This table tracks changes at the storage engine layer, offering deep visibility into how ClickHouse manages data parts — the internal files that make up columnar storage. Because merges, mutations, and part movements directly affect performance and data consistency, system.part_log becomes essential for diagnosing replication issues, inefficient merges, or heavy mutation workloads.
Administrators commonly rely on it to:
- understand how background merges are impacting performance
- detect large or abnormal merges that may indicate inefficient table design
- correlate mutations with user-triggered UPDATE/DELETE operations
- investigate replication lag or part misalignment in multi-node environments
Tracks storage-layer operations such as:
- merges
- part creation & removal
- mutations
- replication events
Example — recent part events:
SELECT event_type, partition_id, table, part_name, rows, bytes, event_time
FROM system.part_log
WHERE event_time > now() - INTERVAL 30 MINUTE
ORDER BY event_time DESC;
Example — show only mutation-related entries:
SELECT *
FROM system.part_log
WHERE event_type = 'Mutation'
ORDER BY event_time DESC;
3. system.trace_log & system.metric_log
These tables reveal the underlying performance characteristics of ClickHouse execution, making them vital for diagnosing bottlenecks and understanding execution paths. system.trace_log captures stack traces from slow queries or specific events, which is extremely useful for performance tuning or identifying problematic JOINs, aggregations, or functions.
system.metric_log provides time-series metric data, enabling teams to correlate resource usage with query spikes, mutations, merges, or large analytical workloads.
They are instrumental for:
- troubleshooting cases where CPU or memory limits are reached
- identifying slow or inefficient query stages
- understanding whether the bottleneck is CPU, memory, I/O, or execution plan
- correlating system pressure with specific users or workloads
Expose execution and performance characteristics:
- CPU usage
- memory spikes
- slow-query stack traces
- thread performance patterns
Example — inspect slow-query stack frames:
SELECT event_time, query_id, trace, arrayJoin(trace) AS frame
FROM system.trace_log
WHERE event_time > now() - INTERVAL 10 MINUTE
ORDER BY event_time DESC;
Example — view system metrics:
SELECT event_time, metric, value
FROM system.metric_log
WHERE metric IN ('MemoryTracking', 'Query')
  AND event_time > now() - INTERVAL 5 MINUTE
ORDER BY event_time DESC;
4. system.query_thread_log
This table provides the lowest-level view of how ClickHouse executes queries internally. Because ClickHouse parallelizes work across CPU threads and distributes tasks across nodes, system.query_thread_log allows administrators to break down a query into its constituent execution units.
This is critical for:
- understanding why a query is slow on one node but fast on another
- diagnosing imbalance or skew in distributed queries
- detecting excessive memory consumption in specific threads
- reconstructing the exact execution timeline of high-impact workloads
It acts as a “microscope” into distributed execution.
Provides thread-level visibility into distributed or parallel execution sequences.
Example — thread-level activity:
SELECT query_id, thread_id, read_rows, read_bytes, memory_usage, event_time
FROM system.query_thread_log
WHERE event_time > now() - INTERVAL 15 MINUTE
ORDER BY event_time DESC;
Example — join thread logs with parent queries:
SELECT t.query_id, q.user, t.thread_id, t.read_rows, t.read_bytes
FROM system.query_thread_log AS t
JOIN system.query_log AS q ON t.query_id = q.query_id
WHERE q.type = 'QueryFinish'
ORDER BY t.event_time DESC;
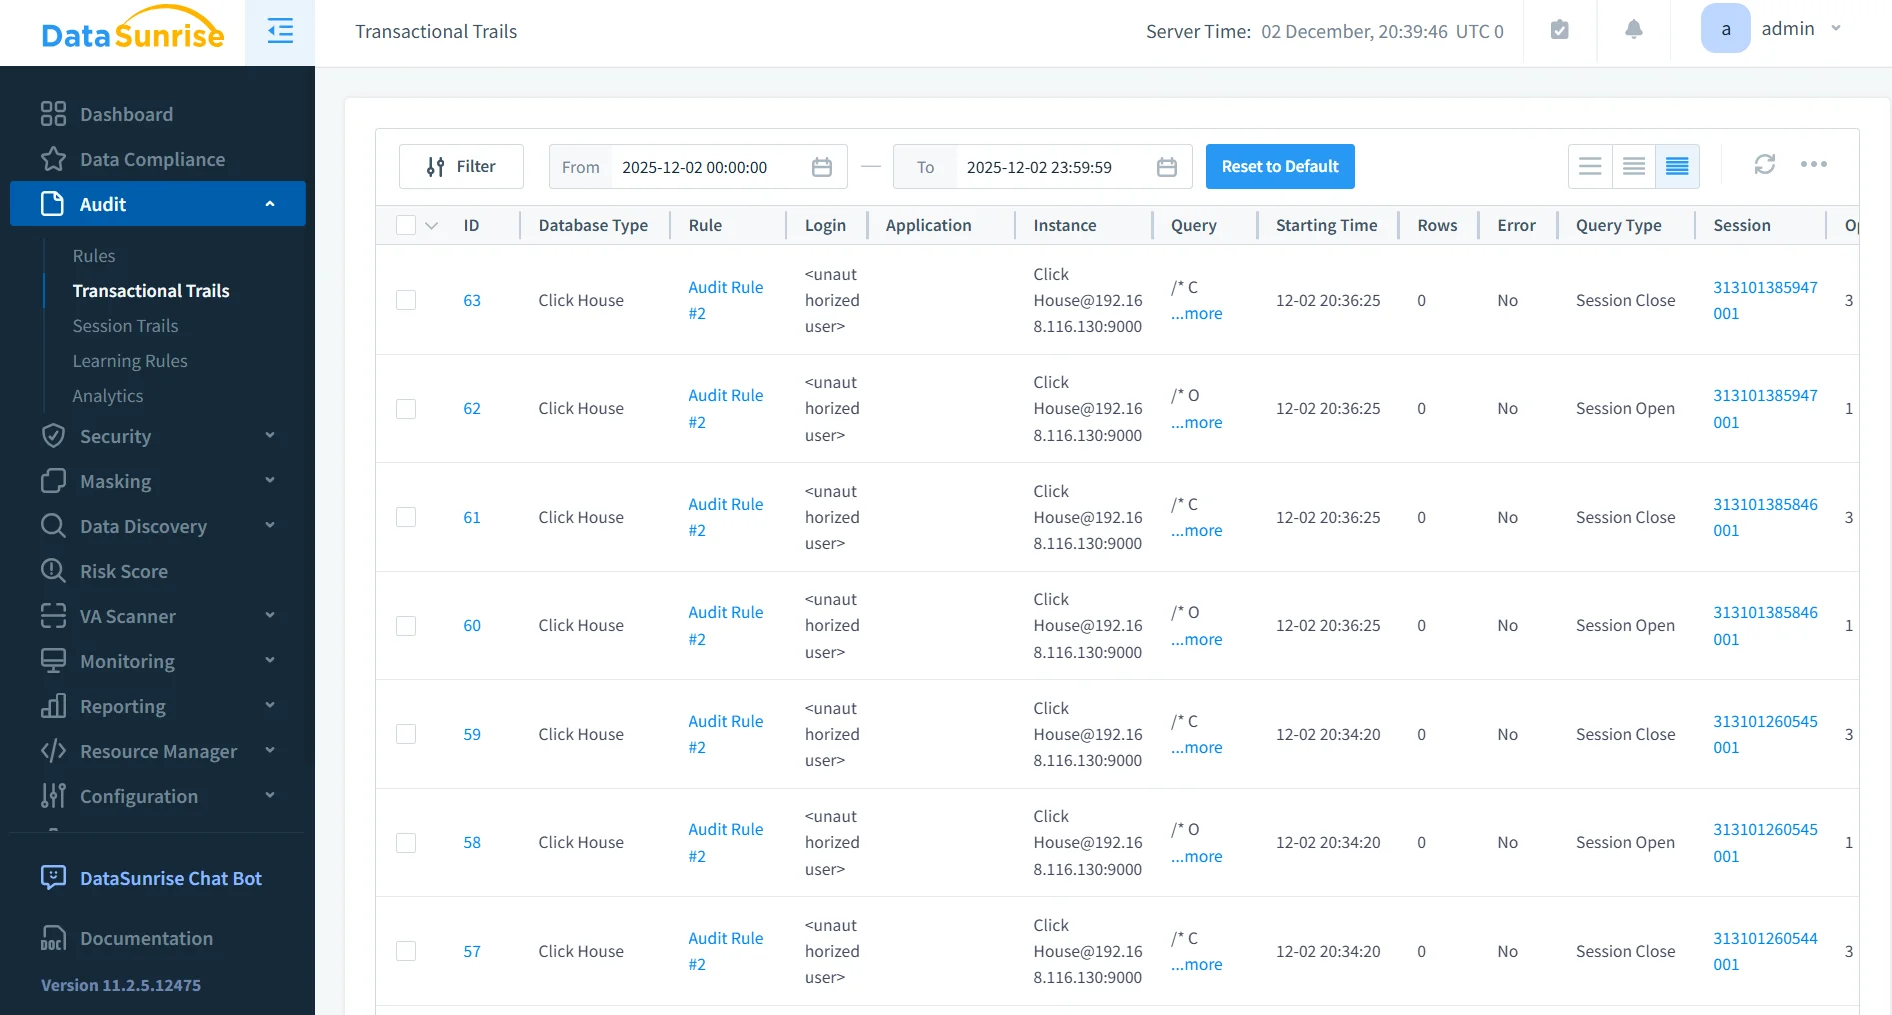
DataSunrise for ClickHouse Database Activity History
DataSunrise consolidates and correlates native ClickHouse logs, augments them with identity and sensitivity metadata, and generates a unified chronological activity timeline aligned with compliance and security requirements.
1. Centralized Activity Timeline
DataSunrise consolidates all ClickHouse activity signals into a unified historical timeline, merging query logs, thread-level execution details, part and merge events, authentication traces, and mutation or replication metadata. Instead of forcing administrators to navigate multiple distributed system tables, DataSunrise correlates these records into a single, coherent narrative that shows exactly what happened, when it happened, who triggered it, and how it propagated across the cluster. This centralized view eliminates the fragmentation inherent to ClickHouse’s distributed architecture and provides a reliable foundation for both compliance and investigation workflows.
- enables full-lifecycle tracking of user and system actions
- correlates distributed-node events into an ordered sequence
- removes ambiguity caused by asynchronous ClickHouse execution
- provides a single source of truth for audits and investigations
2. Identity & Sensitivity Enrichment
Beyond raw engine telemetry, DataSunrise applies enrichment layers that associate every ClickHouse event with real user identities, inherited role structures, and organizational authorization models. It also evaluates the sensitivity of accessed data, annotates whether masking rules were applied, and constructs lineage relationships that show how sensitive information moved between objects. By introducing risk scoring and contextual metadata, DataSunrise transforms basic system entries into audit-ready records that reflect true business-level meaning — something native logs are not designed to express.
- maps ClickHouse technical accounts to real human or application identities
- applies sensitivity labels to accessed datasets
- shows when masking was applied and why
- enriches logs with risk metadata for compliance reporting
3. Behavior Analytics & UEBA
DataSunrise incorporates user and entity behavior analytics (UEBA) to evaluate activity patterns across ClickHouse workloads. Rather than simply recording events, the platform analyzes behavior to detect anomalies such as unexpectedly large scans, off-hours activity, deviations from typical query profiles, sudden schema modifications, or lateral movement signals. This intelligence layer allows organizations to identify insider threats or compromised accounts early, long before damage becomes visible at the system level.
- detects deviations from user-specific behavioral patterns
- highlights risky sequences such as privilege misuse or data exfiltration attempts
- correlates subtle anomalies that ClickHouse alone would miss
- provides predictive insights to stop threats before escalation
4. Integrated Security Enforcement
DataSunrise uses this correlated activity history to power real-time security controls. By integrating with the Database Firewall, enforcing granular Security Rules, and leveraging advanced Threat Detection capabilities, the system can immediately respond to suspicious or non-compliant actions. Depending on policy, DataSunrise may block, mask, throttle, or log the behavior in detail, ensuring that ClickHouse environments are actively protected rather than simply monitored.
- enforces policy-based blocking of unsafe or non-compliant SQL
- applies dynamic masking on sensitive columns in real time
- throttles or restricts suspicious traffic at the proxy layer
- generates alerts and remediation actions based on behavioral risk
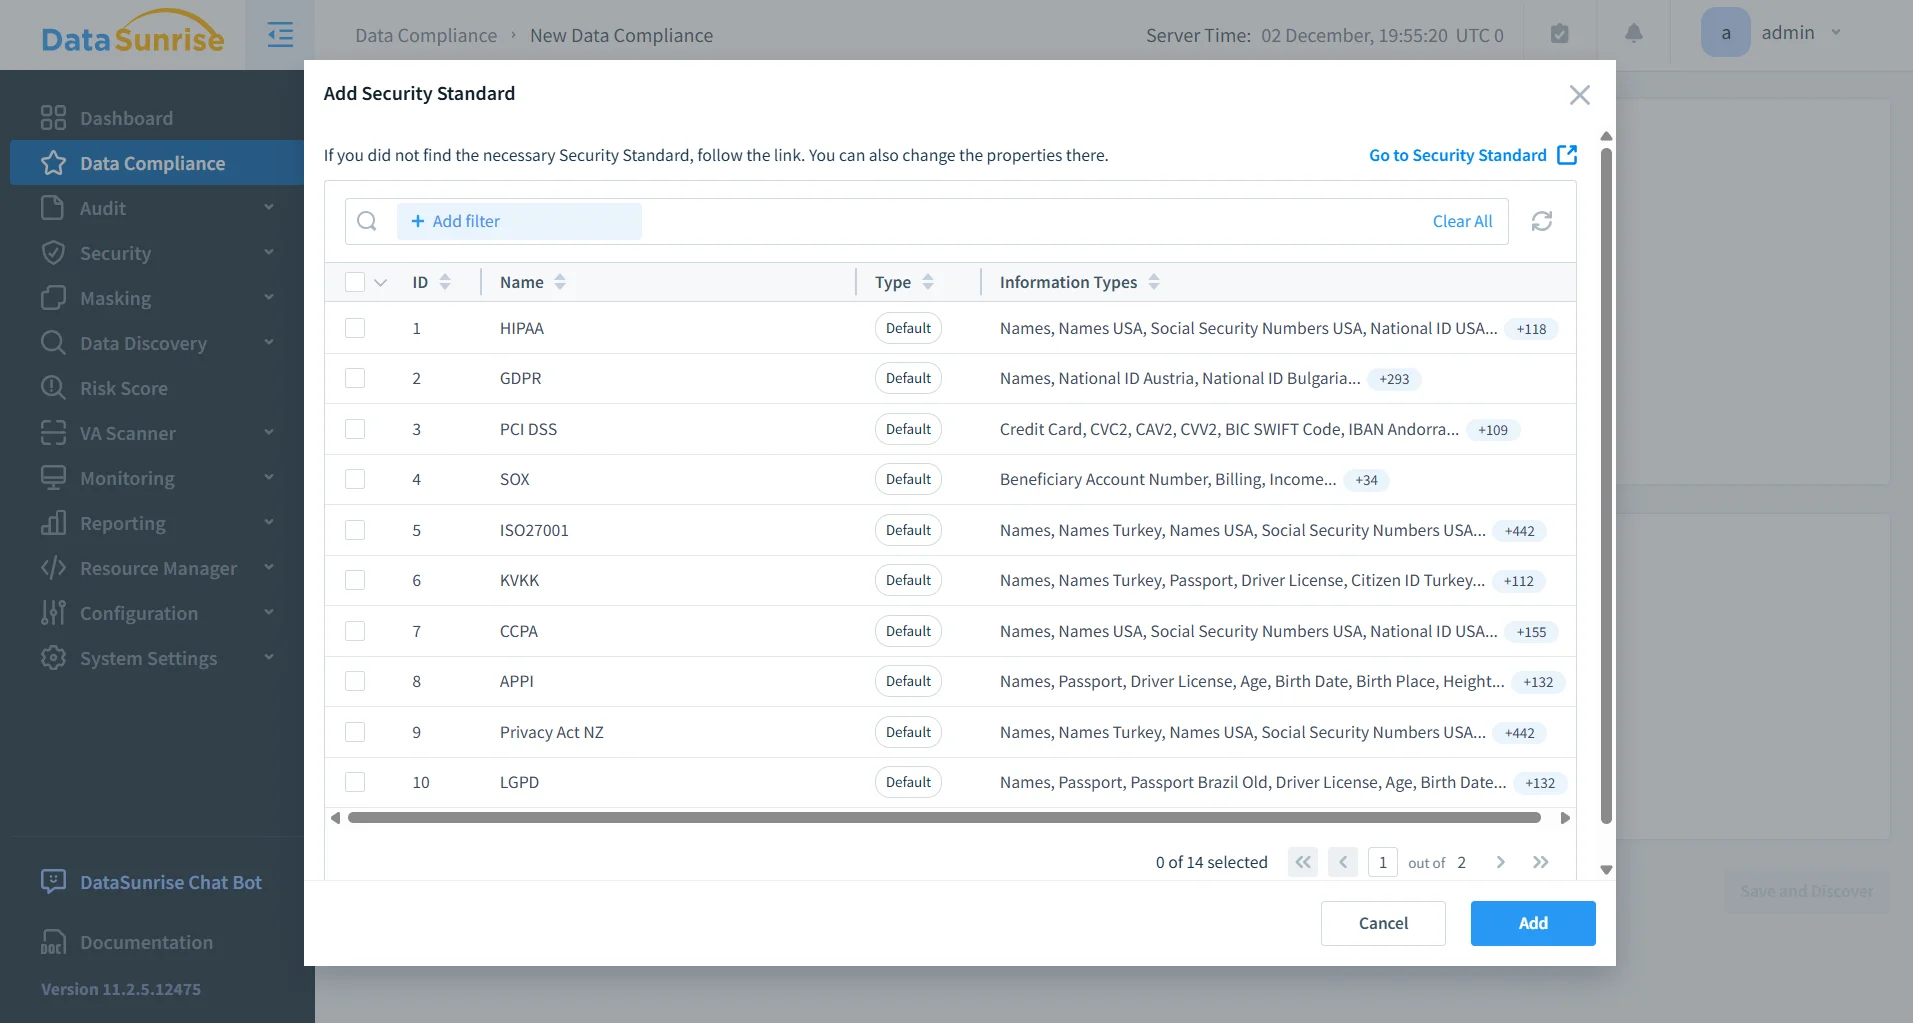
5. Automated Compliance Reporting
Through its integration with the Compliance Manager, DataSunrise generates structured regulatory reports without requiring manual cross-referencing of ClickHouse logs. Events relevant to GDPR, HIPAA, PCI DSS, and SOX are automatically identified, categorized, timestamped, and formatted into auditor-ready output. This automation dramatically reduces preparation time for audits and eliminates the need to manually unify logs from distributed ClickHouse nodes, ensuring consistent and verifiable compliance evidence.
- automatically aggregates required compliance events
- formats activity history into audit-ready documentation
- reduces preparation time for internal and external audits
- ensures consistency of compliance evidence across all ClickHouse clusters
Business Impact
| Business Need | Value Delivered by ClickHouse Activity History |
|---|---|
| Regulatory compliance | Verifiable event lineage that satisfies GDPR, HIPAA, PCI DSS, and SOX audit requirements |
| Accountability | Cluster-wide visibility into actions performed across distributed nodes |
| Investigation efficiency | Faster forensic analysis and incident-resolution workflows |
| Insider threat detection | Early identification of misuse, privilege abuse, or unusual activity patterns |
| Operational transparency | Clear insights into query behaviors, merges, mutations, and storage-level events |
| Audit readiness | Tamper-resistant evidence aligned with enterprise compliance standards |
Conclusion
ClickHouse provides rich telemetry, but fragmentation across nodes makes native logging insufficient for compliance-driven or forensic workflows. DataSunrise converts this raw telemetry into a contextualized, identity-aware, unified activity history, enabling secure and compliant ClickHouse operations with full visibility.
Protect Your Data with DataSunrise
Secure your data across every layer with DataSunrise. Detect threats in real time with Activity Monitoring, Data Masking, and Database Firewall. Enforce Data Compliance, discover sensitive data, and protect workloads across 50+ supported cloud, on-prem, and AI system data source integrations.
Start protecting your critical data today
Request a Demo Download Now