Data Audit for Vertica
Introduction
Vertica is widely used as a high-performance analytical platform. It powers large data warehouses, customer behavior analytics, and real-time reporting. These workloads usually involve highly sensitive data: financial transactions, customer profiles, operational metrics, and logs aggregated from multiple systems. For regulated industries, simply running queries fast is not enough. You must also prove who accessed which data, when, and how.
In practice, a data audit for Vertica typically has two layers. The first layer is native Vertica auditing: internal components such as the Data Collector and monitoring views in the v_monitor schema that record activity inside the database. The second layer is an external audit platform such as
DataSunrise Activity Monitoring. It observes traffic around Vertica, normalizes logs, and turns low-level events into readable trails and compliance reports.
In addition, to see how Vertica fits into a broader compliance strategy, you can also explore DataSunrise data compliance capabilities and regulatory compliance guidance.
Native Data Audit for Vertica
On the database side, Vertica provides several native mechanisms that together form its internal audit layer. Administrators can rely on the Data Collector for workload history and on monitoring views in the v_monitor schema for query and error details. They also use license-oriented AUDIT functions for capacity checks. Used correctly, these tools help reconstruct who ran which queries and whether they succeeded. They also highlight what went wrong when they did not.
Data Collector and Monitoring Configuration
To begin with, the Data Collector is an internal diagnostics utility that records session and workload history for all connections by default. It captures performance counters and statistics that feed monitoring views such as v_monitor.query_requests. A superuser can temporarily disable it if necessary, although this is not recommended for long-term operation.
Example configuration changes:
-- Disable Data Collector (not recommended for long term)
SELECT SET_CONFIG_PARAMETER('EnableDataCollector', '0');

-- Re-enable Data Collector
SELECT SET_CONFIG_PARAMETER('EnableDataCollector', '1');
In most environments, the Data Collector remains enabled. As a result, audit and monitoring queries against v_monitor always have fresh data.
Tracking Query Activity with v_monitor.query_requests
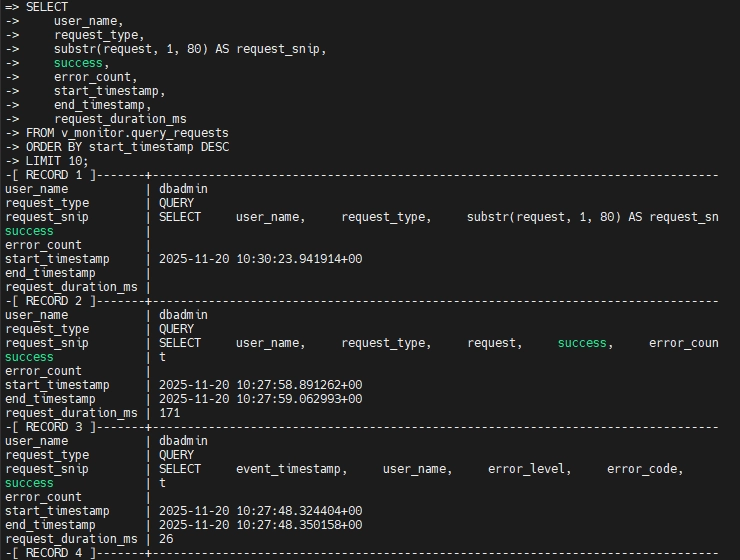
The main view for query-level audit is v_monitor.query_requests. It records each user-issued request with details such as user_name, request_type, a snippet of the SQL text, timestamps, success flag, and error_count.
A basic query to inspect the latest activity looks like this:
SELECT
    user_name,
    request_type,
    substr(request, 1, 80) AS request_snip,
    success,
    error_count,
    start_timestamp,
    end_timestamp,
    request_duration_ms
FROM v_monitor.query_requests
ORDER BY start_timestamp DESC
LIMIT 10;
As shown in the Vertica console output below, this view gives a compact summary of who ran which statements, whether they succeeded, and how long they took. This level of detail is enough to reconstruct recent user activity at a glance.
Investigating Errors with v_monitor.error_messages
While v_monitor.query_requests summarizes success and error counts per statement, Vertica stores detailed error information in v_monitor.error_messages. This view includes error level, code, message text, and timestamps. As a result, it is useful for understanding failed logins, permission issues, and runtime errors.
SELECT
    event_timestamp,
    user_name,
    error_level,
    error_code,
    message
FROM v_monitor.error_messages
ORDER BY event_timestamp DESC
LIMIT 20;
By combining v_monitor.query_requests and v_monitor.error_messages, teams can see both what a user attempted to do and why it failed. This combined view is important for troubleshooting and forensics.
License-Oriented AUDIT Function
At the same time, Vertica also provides an AUDIT() management function that estimates data size for license compliance using the same sampling method as license checks. This enables capacity planning and license management.
SELECT AUDIT('database', 'full', 0.05, 0.95);
However, this function is useful mainly for understanding database footprint, and it is not a security audit trail. In a security and compliance context, it should be mentioned separately from activity logging.
Limitations of Native Data Audit for Vertica
Although Vertica’s native audit tools are powerful for database administrators, they have practical limitations for security and compliance teams:
| Area | Limitation |
|---|---|
| UI and accessibility | Everything is queried via system views; there is no business-friendly UI or drill-down dashboards for non-DBA stakeholders. |
| Scope of visibility | Audit data lives inside Vertica only. Cross-database or cross-cloud visibility requires custom aggregation and external tooling. |
| Policy abstraction | There are no high-level audit rules such as “log all access to PII tables by contractors”. Instead, teams must compose queries and filters manually against system tables. |
| Multi-environment operations | If you run multiple Vertica clusters (test, staging, production, regional), each maintains its own logs and audit view. Correlating activity across them is manual and error-prone. |
| Retention and export | Organizations must design their own retention policies, export pipelines, and alerting on top of v_monitor and log files. |
As a result, these gaps drive many organizations to complement native Vertica capabilities with a dedicated database activity monitoring and security platform that centralizes logging, adds security policies, and automates compliance tasks.
Data Audit for Vertica with DataSunrise
DataSunrise is deployed as a proxy, sniffer, or log-based monitor in front of Vertica and other databases. It observes SQL traffic in real time, parses each statement, and writes structured audit events to its own repository. Those events can be enriched with context such as user, role, client IP, application, and risk score. Afterwards, they can be correlated across heterogeneous platforms.
In addition, by combining native Vertica logs with DataSunrise Activity Monitoring, you keep the low-level accuracy of system tables while gaining centralized policies, user-friendly dashboards, and governance across multiple databases.
Integration Architecture
For Vertica, a typical deployment looks like this:
- Client applications and BI tools connect to a DataSunrise proxy endpoint instead of directly to Vertica.
- DataSunrise forwards traffic to the Vertica service while logging every request and response.
- Audit records appear in DataSunrise’s Audit or Transactional Trails views, where they can be filtered, exported, and correlated with events from other systems.
Because DataSunrise works at the network and protocol level, it does not require changes to Vertica schemas or to the applications themselves.
Creating an Audit Rule for Vertica
Once the Vertica data source is registered in DataSunrise, you can define an audit rule to capture activity:
- Create a new Audit rule and select the Vertica data source.
- Configure the rule to log all CRUD operations, or narrow it down to specific schemas and tables that contain sensitive data discovered via Sensitive Data Discovery.
- Optionally filter by users or roles (DBAs, reporting users, ETL accounts), client IP ranges (VPN vs. internal), or applications (BI tools vs. batch jobs).
- Choose where to store audit events, using the internal repository or an external database.
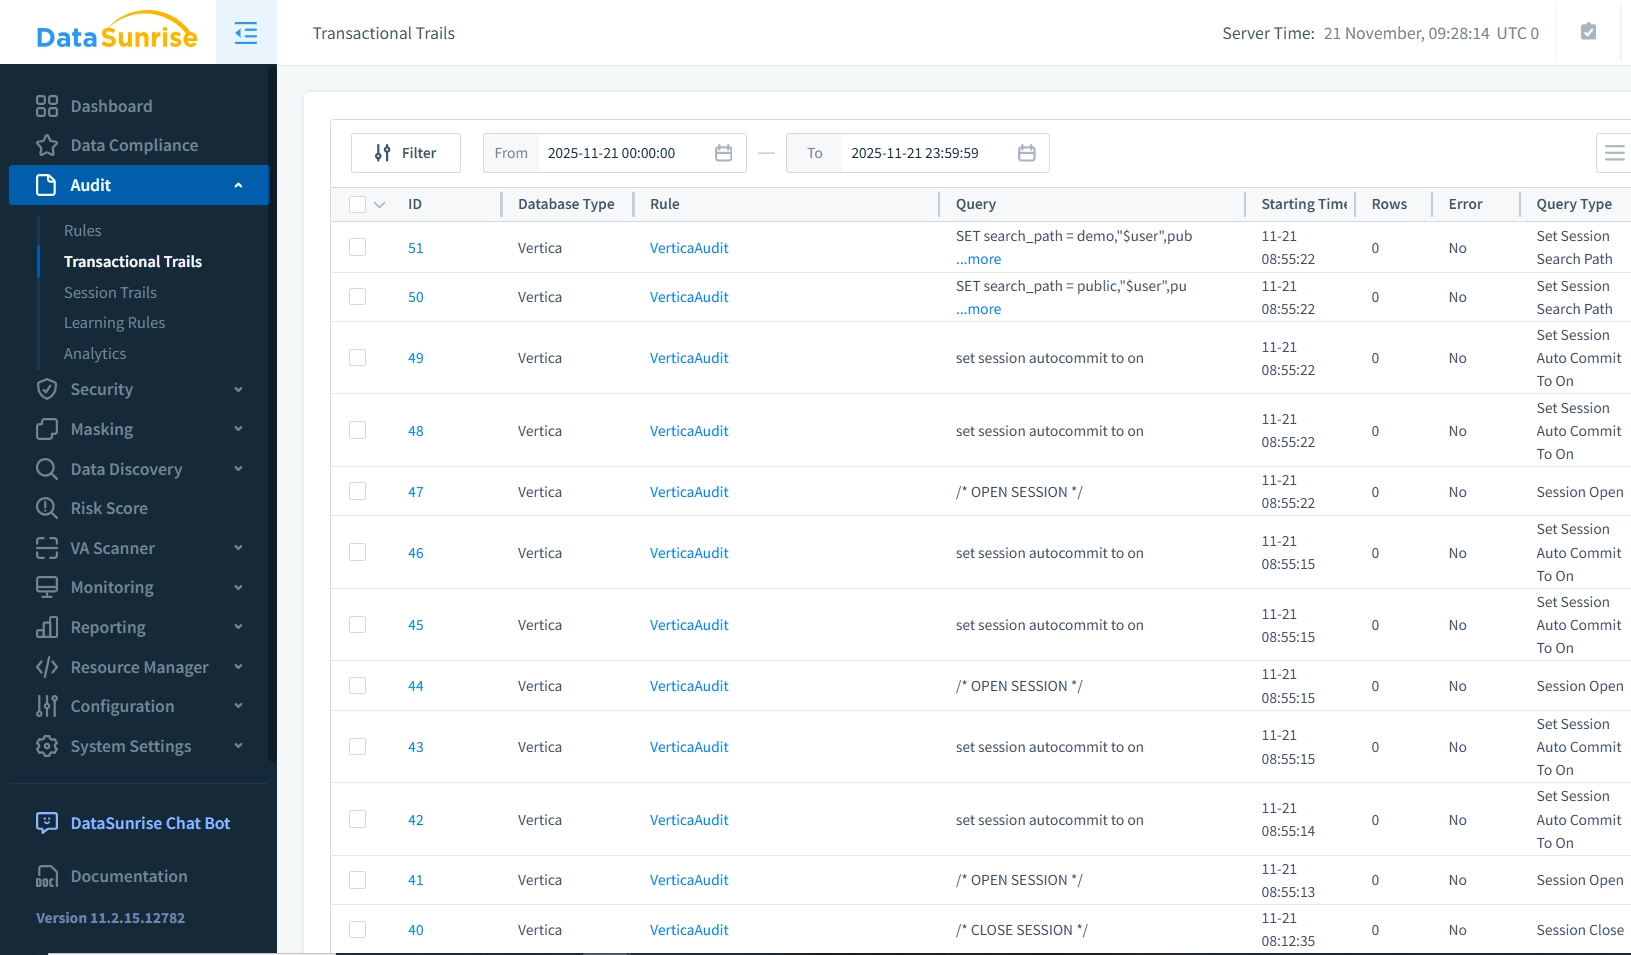
This configuration corresponds to the rule definition screens in DataSunrise, where Vertica is the selected instance. All SQL statements passing through the proxy are visible in the results grid.
Viewing Audit Trails in DataSunrise
After executing typical operations such as:
SELECT * FROM ds_demo.audit_test;
UPDATE ds_demo.audit_test
SET full_name = 'ZZZ'
WHERE id = 1;
DELETE FROM ds_demo.audit_test
WHERE id = 2;
DataSunrise records each operation with rich context. In the Transactional Trails or Audit view you typically see timestamp and duration of each request, database type and instance (Vertica), user name and client application, source IP and connection details, full SQL text and affected objects, and the rule that triggered logging, such as a general Vertica audit policy.
Placed next to the Vertica v_monitor.query_requests console screenshot, the DataSunrise screenshot visually shows the same activity but in a more accessible, filterable format.
Advanced Audit Capabilities with DataSunrise
While Vertica focuses on infrastructure-level logging, DataSunrise adds security and compliance features on top:
- Real-time monitoring and alerts. Trigger alerts when sensitive tables are queried outside business hours, from unknown IP addresses, or by non-privileged accounts. You can also route them into SIEM or SOAR platforms alongside other DAM events.
- Centralized logs across multiple databases. Correlate Vertica activity with other platforms such as PostgreSQL, Hive, Teradata, and cloud data warehouses in a single dashboard, using the same Compliance Manager framework.
- Context-aware policies. Define rules like “log all access to analytics schemas from contractor accounts” or “track all failed logins and privilege changes” using DataSunrise’s database firewall and audit policies.
- Flexible retention and export. Store audit logs in the internal repository or stream them to SIEM and SOC tools for long-term retention and advanced analytics.
- Combination with masking and discovery. Apply dynamic and static data masking to sensitive columns and simultaneously log all attempts to read unmasked data. You can then tie audit events to discovery results.
Business and Compliance Benefits
Overall, implementing a robust data audit strategy for Vertica with DataSunrise delivers tangible benefits:
| Benefit | What it provides |
|---|---|
| Improved incident response | Detailed trails of Vertica activity dramatically reduce the time needed to understand what happened. They also show who was involved and which data was affected. |
| Stronger insider threat detection | Continuous monitoring of privileged and analytical users highlights abnormal access patterns that traditional perimeter controls might miss. |
| Audit-ready evidence | Centralized logs and predefined reports help satisfy auditors’ requests without assembling artifacts from multiple disconnected systems, especially when combined with Database Activity Monitoring best practices. |
| Reduced compliance overhead | Automated reporting and long-term retention policies lower the manual workload for security and compliance teams. |
| Unified control across platforms | Because the same DataSunrise deployment can cover Vertica and other databases, teams avoid building one-off solutions per platform. They also keep a consistent data-centric security model. |
Conclusion
Vertica provides solid native tools for data auditing through the Data Collector and system views in v_monitor, particularly query_requests and error_messages. These capabilities are ideal for DBAs and performance engineers who need precise technical visibility into sessions and queries.
However, native features alone leave gaps in correlation, reporting, and long-term governance. Data Audit for Vertica with DataSunrise closes these gaps by capturing every query and session with full context, applying real-time security policies, and automating compliance reporting. By combining Vertica’s native audit data with DataSunrise’s proxy-based monitoring, rule engine, and reporting UI, you gain a complete picture of Vertica activity. It remains technically accurate while still being accessible to security and compliance stakeholders.
Therefore, conducting a thorough data audit for Vertica is essential for ensuring that your enterprise data remains secure, compliant, and accessible. While Vertica offers strong native auditing capabilities, integrating an advanced platform like DataSunrise can take your security posture to the next level. From real-time monitoring to centralized trails, reporting, and compliance support, DataSunrise addresses the growing needs of modern data-driven organizations.
For a higher-level view of how Vertica audit fits into centralized monitoring with DataSunrise, including architecture diagrams and UI examples, read Database Audit for Vertica.
Protect Your Data with DataSunrise
Secure your data across every layer with DataSunrise. Detect threats in real time with Activity Monitoring, Data Masking, and Database Firewall. Enforce Data Compliance, discover sensitive data, and protect workloads across 50+ supported cloud, on-prem, and AI system data source integrations.
Start protecting your critical data today
Request a Demo Download Now