Databricks SQL Audit Log
Databricks SQL is widely used as an analytical query engine in lakehouse architectures, supporting dashboards, ad-hoc analytics, and automated reporting at scale. As more users and applications interact with shared datasets, organizations must maintain visibility into database activity. A Databricks SQL audit log plays a central role in providing this visibility.
An audit log records individual database events as they occur. It captures executed SQL statements together with metadata such as timestamps, user identity, query type, and execution status. In Databricks SQL environments, audit logs form the first layer of accountability by showing exactly what actions were performed against the database.
This article explains what an audit log means in the context of Databricks SQL, how native logging works, where its limitations appear, and how DataSunrise extends audit logging with centralized, enriched records suitable for security and compliance use cases.
What Is an Audit Log in Databricks SQL?
A Databricks SQL audit log is a record of discrete database events. Each log entry represents a single action, such as a SELECT, UPDATE, or DELETE statement, executed against the SQL warehouse. Along with the query itself, the log typically stores metadata including execution time, duration, user, and query type.
Audit logs differ from audit trails or activity history. While trails and histories focus on sequencing or long-term behavior, an audit log concentrates on capturing each event accurately at the moment it occurs. These records serve as the raw evidence layer for further analysis and investigation.
In regulated environments, audit logs are essential. Standards such as GDPR, HIPAA, PCI DSS, and SOX require organizations to maintain accurate records of database access and changes.
Native Databricks SQL Audit Logs
Databricks SQL provides native query logging that captures executed statements and basic execution metadata. This native audit log is accessible through the Databricks interface and is often used by administrators to review recent activity.
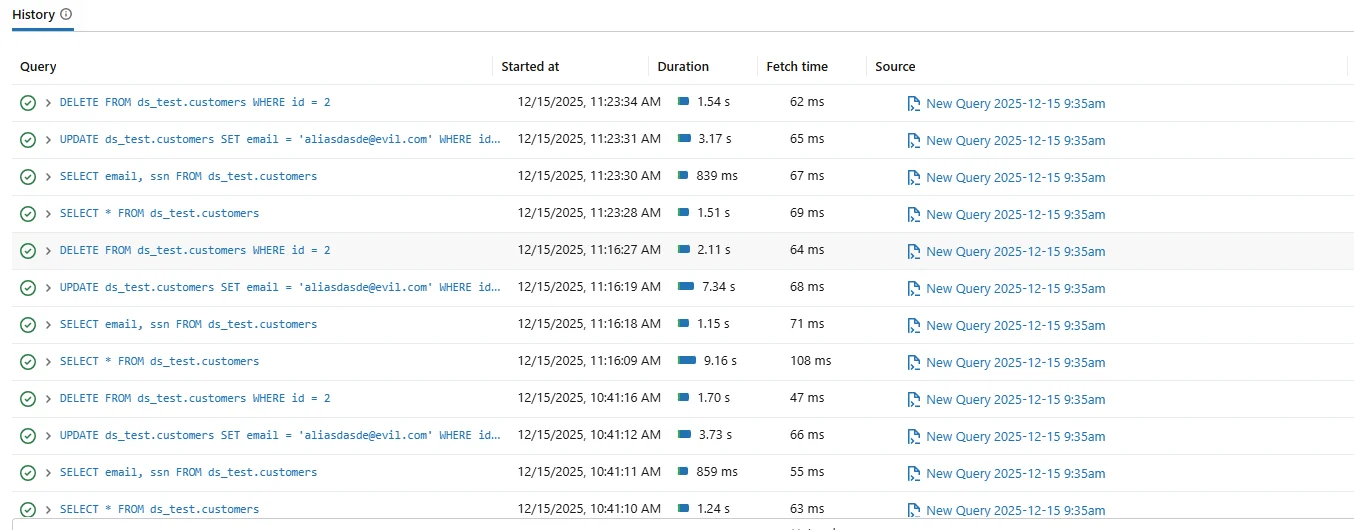
Native Databricks SQL audit log showing executed queries with timestamps and execution details.
Native audit logs typically include the query text, start time, duration, execution status, and the user who initiated the request. For short-term troubleshooting or performance analysis, this visibility is often sufficient.
However, native audit logs are usually limited in retention and context. Logs may be rotated, aggregated, or exported to external platforms such as Azure Log Analytics or Amazon CloudWatch for storage and search.
Examples of SQL Statements Captured in the Audit Log
Each entry in a Databricks SQL audit log corresponds to a single executed SQL statement. For example, when a user reads data from a table, the audit log records the exact SELECT operation together with execution metadata.
SELECT email, ssn FROM ds_test.customers;
When data is modified, the audit log records write operations such as UPDATE statements with the same level of detail. These records are critical for tracing data changes and investigating potential misuse.
UPDATE ds_test.customers SET email = '[email protected]' WHERE id = 2;
In both cases, the audit log stores not only the SQL text, but also execution time, query type, user identity, and result status. This allows teams to understand exactly what action was performed and whether it succeeded.
Limitations of Native Audit Logging
While native Databricks SQL audit logs capture events accurately, they were not designed as a complete auditing solution. Logs often lack correlation between related events, making it difficult to reconstruct complex workflows or user sessions.
In addition, native logs usually focus on execution details rather than audit governance. They do not always provide centralized storage, immutability guarantees, or structured reporting required during audits.
As a result, organizations relying solely on native logs often face challenges when responding to compliance requests or conducting forensic investigations.
How the Databricks SQL Audit Log Is Built
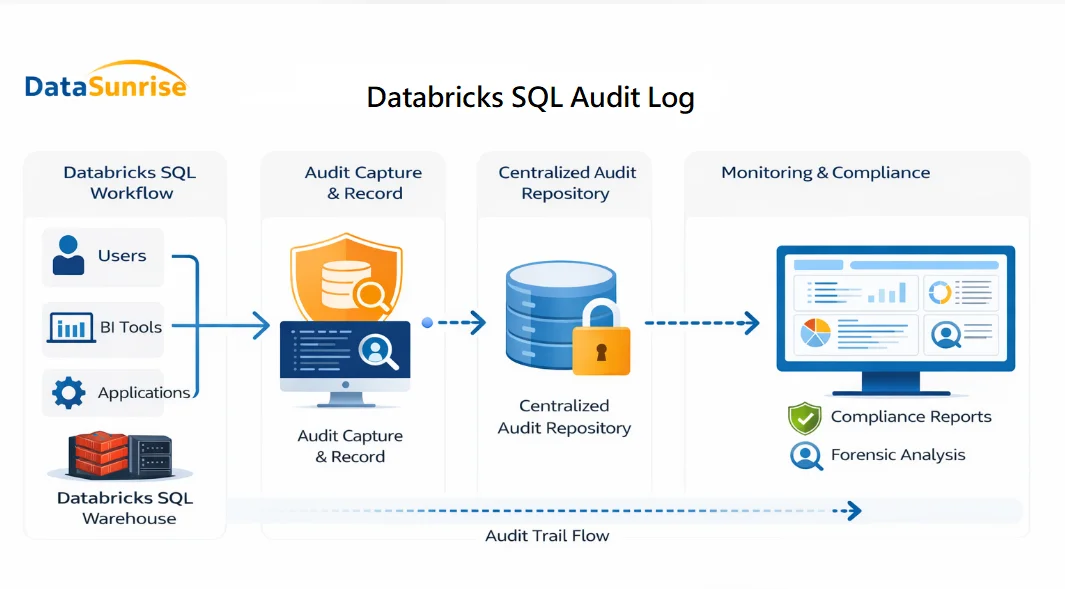
Conceptual flow showing how Databricks SQL queries are captured, stored, and analyzed as part of a centralized audit log.
The diagram illustrates how a Databricks SQL audit log is created and consumed across the analytics workflow. SQL queries originate from users, BI tools, and applications and are executed inside the Databricks SQL warehouse.
As each query is processed, audit log events are captured at execution time. These events include the SQL statement, the user or service account that initiated it, execution timestamps, and the final status of the operation.
Instead of remaining fragmented across platform logs, DataSunrise collects these events and writes them into a centralized audit log repository. From this repository, records become available for monitoring, investigation, and compliance reporting.
Centralized Audit Logging with DataSunrise
DataSunrise enhances Databricks SQL audit logging by capturing SQL activity in real time and storing it in a centralized audit log repository. Instead of collecting logs from multiple sources, DataSunrise consolidates events into a single, normalized format.
Each audit log entry recorded by DataSunrise includes enriched metadata such as database type, query category, session identifiers, execution outcome, and application context. This enrichment transforms raw events into audit-ready records.
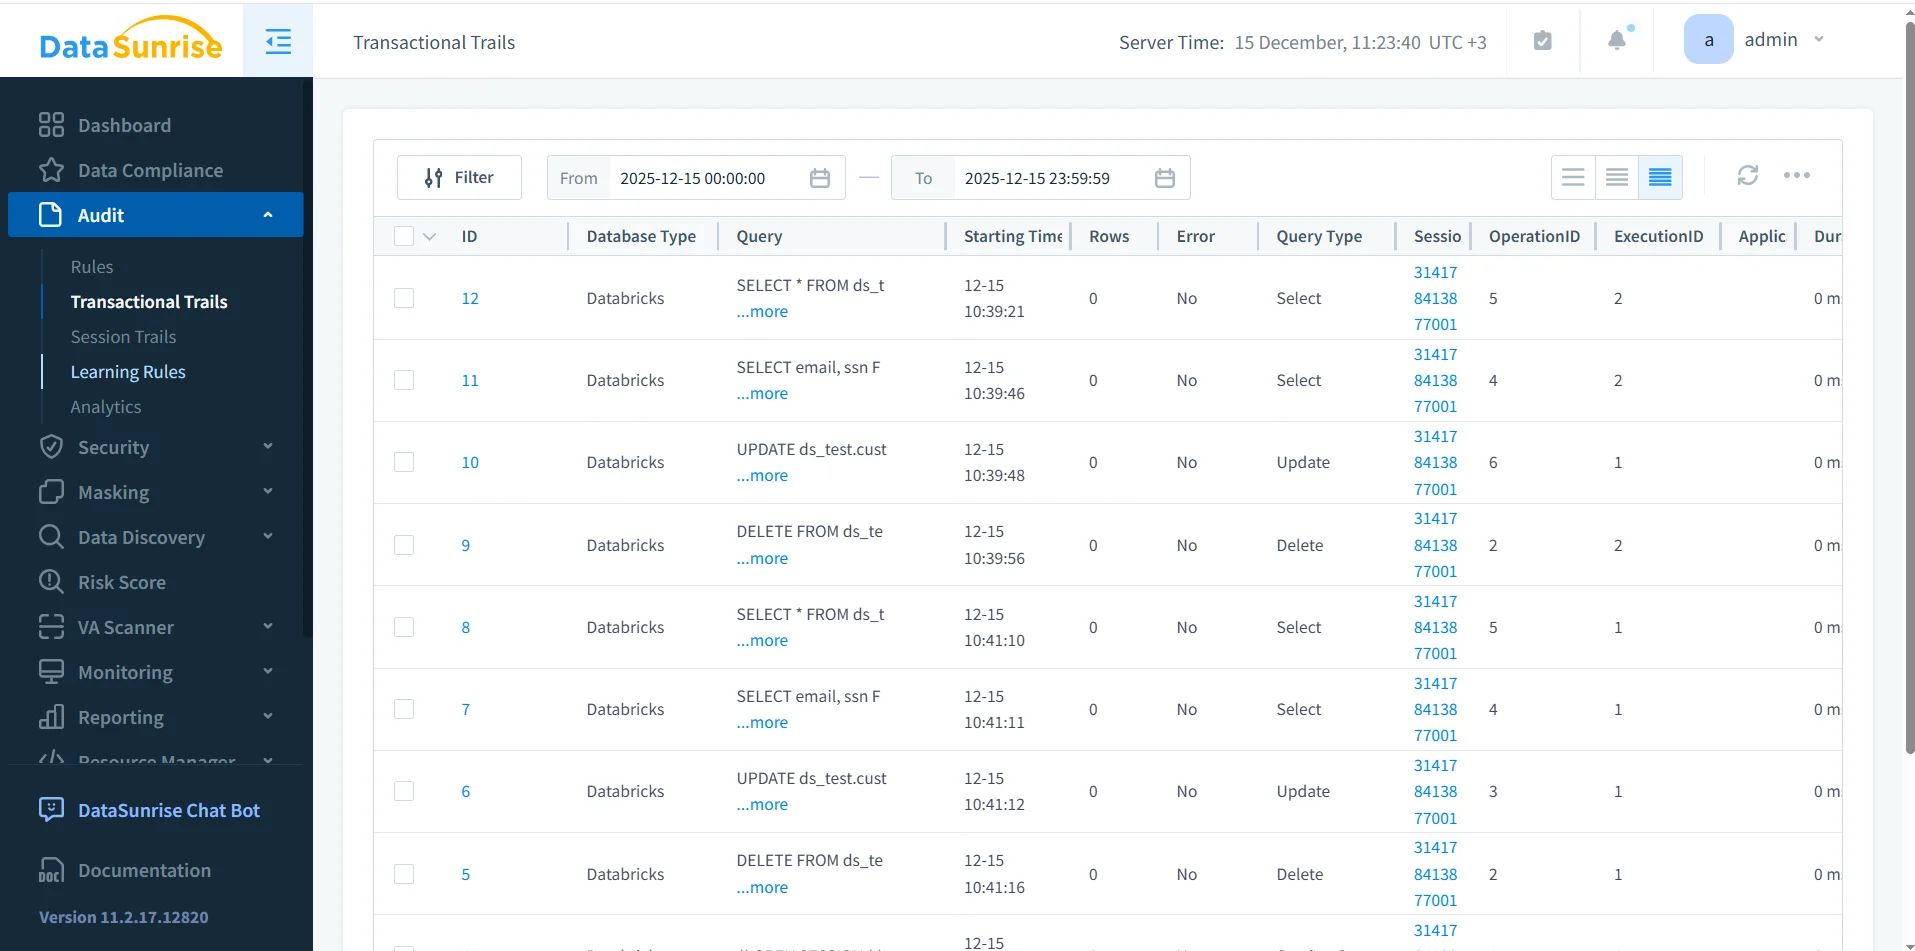
DataSunrise audit log view showing centralized records of Databricks SQL queries.
Because logs are stored centrally, teams can search, filter, and review Databricks SQL activity across users and time periods without manually aggregating data.
Audit Log vs Audit Trail
It is important to distinguish between an audit log and an audit trail. An audit log captures individual events, while an audit trail organizes those events into a chronological sequence with contextual relationships.
In practice, audit logs serve as the foundation for building trails and histories. For a detailed explanation of this relationship, see Audit Log documentation, which describes how raw events are collected and used in auditing workflows.
By maintaining accurate audit logs, organizations ensure that higher-level audit structures remain trustworthy.
Operational and Compliance Use Cases
Databricks SQL audit logs support a wide range of use cases. Security teams review logs to investigate suspicious activity or unauthorized access. Database administrators use them to analyze query behavior and system usage.
From a compliance perspective, audit logs provide evidence that access to sensitive data is monitored. When combined with database activity monitoring and data compliance controls, audit logs become part of a defensible governance framework.
Centralized audit logging also simplifies reporting and reduces the time required to respond to audit requests.
Conclusion: Managing Databricks SQL Audit Logs
Databricks SQL audit logs provide essential visibility into database activity. Native logging captures executed queries and execution details, offering a starting point for monitoring.
However, enterprise environments require more than basic logs. Centralized Databricks SQL audit logs built with DataSunrise deliver enriched, searchable, and compliance-ready records that support investigations and regulatory audits.
By implementing a robust audit logging strategy, organizations can operate Databricks SQL with confidence, transparency, and strong governance.
Protect Your Data with DataSunrise
Secure your data across every layer with DataSunrise. Detect threats in real time with Activity Monitoring, Data Masking, and Database Firewall. Enforce Data Compliance, discover sensitive data, and protect workloads across 50+ supported cloud, on-prem, and AI system data source integrations.
Start protecting your critical data today
Request a Demo Download Now