Amazon Redshift Database Activity History
Amazon Redshift powers large-scale analytical workloads, but its operational telemetry is notoriously fragmented. Query traces live in STL_* system tables, scan-level details hide in SVL_* views, and session metadata scatters itself across multiple system logs. None of these components provide a unified execution narrative out of the box. As clusters grow — autoscaling, concurrency scaling, and multi-warehouse operations included — this fragmentation becomes a real governance liability. According to the official AWS documentation on Redshift system tables, these logs were never designed to serve as a centralized activity history, which reinforces the need for an external consolidation layer.
A centralized Amazon Redshift database activity history resolves this by reconstructing query events into coherent timelines. It enables security teams, data engineers, and compliance auditors to see how workloads behave, what data they access, who initiates changes, and whether anything suspicious is happening. Platforms such as DataSunrise extend this capability by enriching native logs with sensitive-data classification and unified monitoring layers Database Activity Monitoring).
This article breaks down Redshift’s native activity-history mechanisms, the challenges inherent in AWS’s distributed architecture, and how DataSunrise consolidates scattered logs into a unified, audit-ready history suitable for investigations, compliance, and real-time monitoring. For foundational context on governance methods, you may also refer to our material on Data Activity History, as the same principles apply across analytical architectures.
By correlating node-level log fragments with user identity, object sensitivity, and security posture, DataSunrise closes the visibility gaps left by Redshift’s native subsystems — a concept further explored in our guide on Audit Logs.
Importance of Database Activity History
Database activity history becomes indispensable in modern Redshift deployments where multiple workloads, shared schemas, and distributed teams operate simultaneously. Historical visibility ensures operational accountability, reduces uncertainty during incident investigations, and provides the context required for audit-grade evidence.
Key value points include:
- Reliable forensic reconstruction essential for understanding system-wide impact during failures or anomalies.
- Verification of data-access legitimacy, providing clarity on who interacted with sensitive datasets and when.
- Detection of subtle workload deviations that may indicate configuration drift or early signs of compromise.
- Alignment with compliance frameworks, where historical access patterns must be provable and reproducible.
- Consistency across multi-cluster architectures, ensuring centralized visibility beyond what Redshift natively exposes.
A mature activity-history capability transforms Redshift from a fast analytics engine into a fully governed, operationally transparent data platform.
Native Redshift Activity History Sources
Amazon Redshift exposes activity-related information through several low-level logs and system tables. Each structure contributes a partial viewpoint of query behavior, but none provide full correlation.
1. STL System Tables
STL system tables are the foundational telemetry layer in Amazon Redshift. They store node-level execution events, which means the database records what each compute slice did, but not how the entire query behaved as a whole. This is powerful for low-level diagnostics but inherently fragmented.
Key STL tables include:
stl_query— SQL text, timestamps, execution duration, aborted status.stl_connection_log— authentication attempts and session lifecycle events.stl_insert/stl_update/stl_delete— DML operations modifying table data.stl_ddltext— all DDL events including CREATE, ALTER, DROP.Additional useful tables:
stl_querytext— full SQL text across multiple rowsstl_wlm_query— WLM queue placement and performancestl_error— runtime errors and failure diagnostics
These tables collectively represent how Redshift executed a query locally on each node, but not how the nodes interacted in a unified way.
Example: Retrieve Recent Queries
SELECT
    query,
    userid,
    starttime,
    endtime,
    substring,
    aborted
FROM stl_query
ORDER BY starttime DESC
LIMIT 30;
Example: Reconstruct Full SQL Text
SELECT
    q.query,
    LISTAGG(t.text, '') WITHIN GROUP (ORDER BY t.sequence) AS full_sql
FROM stl_query q
JOIN stl_querytext t
    ON q.query = t.query
WHERE q.userid <> 1  -- filter out system queries
GROUP BY q.query
ORDER BY q.starttime DESC
LIMIT 10;
2. SVL Virtual Log Views
SVL views aggregate STL logs and expose a higher-level view of how the query actually ran. Think of them as “execution summaries” created by Redshift, but still lacking cross-event correlation.
Core SVL objects include:
svl_qlog— query lifecycle metrics (start, end, allocation, completion).svl_scan— table scan metrics, rows processed, bytes scanned, scan type.svl_statementtext— normalized SQL representation for pattern analysis.Other relevant views:
svl_hash— details of hash join operationssvl_s3query— activity generated by Redshift Spectrum
These views help teams understand how Redshift processed queries physically, but they still do not form a full activity timeline across sessions, users, and workloads.
Example: Scan Introspection
SELECT
    q.query,
    q.userid,
    s.tbl AS table_id,
    s.rows,
    s.bytes,
    s.is_rrscan AS redistribution_required,
    q.starttime
FROM svl_qlog q
JOIN svl_scan s
    ON q.query = s.query
ORDER BY q.starttime DESC
LIMIT 20;
Example: Retrieve Normalized Statement Text
SELECT
    query,
    sequence,
    text
FROM svl_statementtext
WHERE query = <QUERY_ID>
ORDER BY sequence;
3. System-Level & External Logs
Redshift’s observability stack is completed by system-level and AWS-managed logging channels. These logs introduce context that STL/SVL tables cannot provide alone:
- CloudWatch audit streams — captures queries, connection attempts, and errors in a central log service.
- WLM Queue Logs — tracks queue assignment, wait time, concurrency throttling, and slot utilization.
- Redshift Data API logs — crucial for serverless workflows and application-driven SQL execution.
- Spectrum logs — visibility into S3-based external table reads and processing.
These sources provide essential metadata, but stitching them together with STL/SVL is still a manual effort.
Example: WLM Performance Analysis
SELECT
    service_class,
    query,
    total_queue_time,
    total_exec_time,
    wlm_start_time,
    wlm_end_time
FROM stl_wlm_query
ORDER BY wlm_start_time DESC
LIMIT 25;
Example: View Recent Execution Errors
SELECT
    query,
    userid,
    starttime,
    endtime,
    result,
    TRIM(error) AS error_message
FROM stl_error
ORDER BY starttime DESC
LIMIT 20;
Example: CloudWatch Insights — Redshift Audit Queries
fields @timestamp, @message
| filter @message like /Connection|Query|Error/
| sort @timestamp desc
| limit 50
How DataSunrise Builds a Complete Redshift Database Activity History
DataSunrise eliminates Redshift’s native fragmentation by producing a holistic, normalized, and compliance-ready activity history. Instead of stitching together low-level logs, organizations gain a single, coherent operational storyline enriched with risk context, sensitivity awareness, and user attribution.
DataSunrise provides this through:
1. Reverse Proxy Correlation Engine
The DataSunrise reverse proxy becomes a single authoritative observation point for all SQL traffic targeting Amazon Redshift. Because every query flows through the proxy, the platform captures context that Redshift’s native logs never see, such as application identity, client IP lineage, and cross-query behavioral patterns. SQL is normalized, tokenized, enriched with sensitivity metadata, and correlated with execution context before a record is written.
This results in fully deterministic audit entries—not the node-scattered fragments produced by STL/SVL—but complete, user-attributed actions suitable for forensic reconstruction and compliance reporting.
For a deeper look at centralized monitoring principles, see:
→ Database Activity Monitoring
2. Centralized Activity History Timeline
DataSunrise merges Redshift’s otherwise disjointed signals into a global, chronologically ordered timeline. Instead of piecing together STL logs, WLM records, and CloudWatch entries manually, the platform synthesizes everything into a unified historical narrative. This includes authentication attempts, DML/DDL events, sensitive object access, policy matches, and security alerts.
The system resolves timestamp drift, node-local execution inconsistencies, and fragmented event models — producing a cohesive storyline of how users and applications interact with Redshift over time.
More about structured history can be found here:
→ Data Activity History
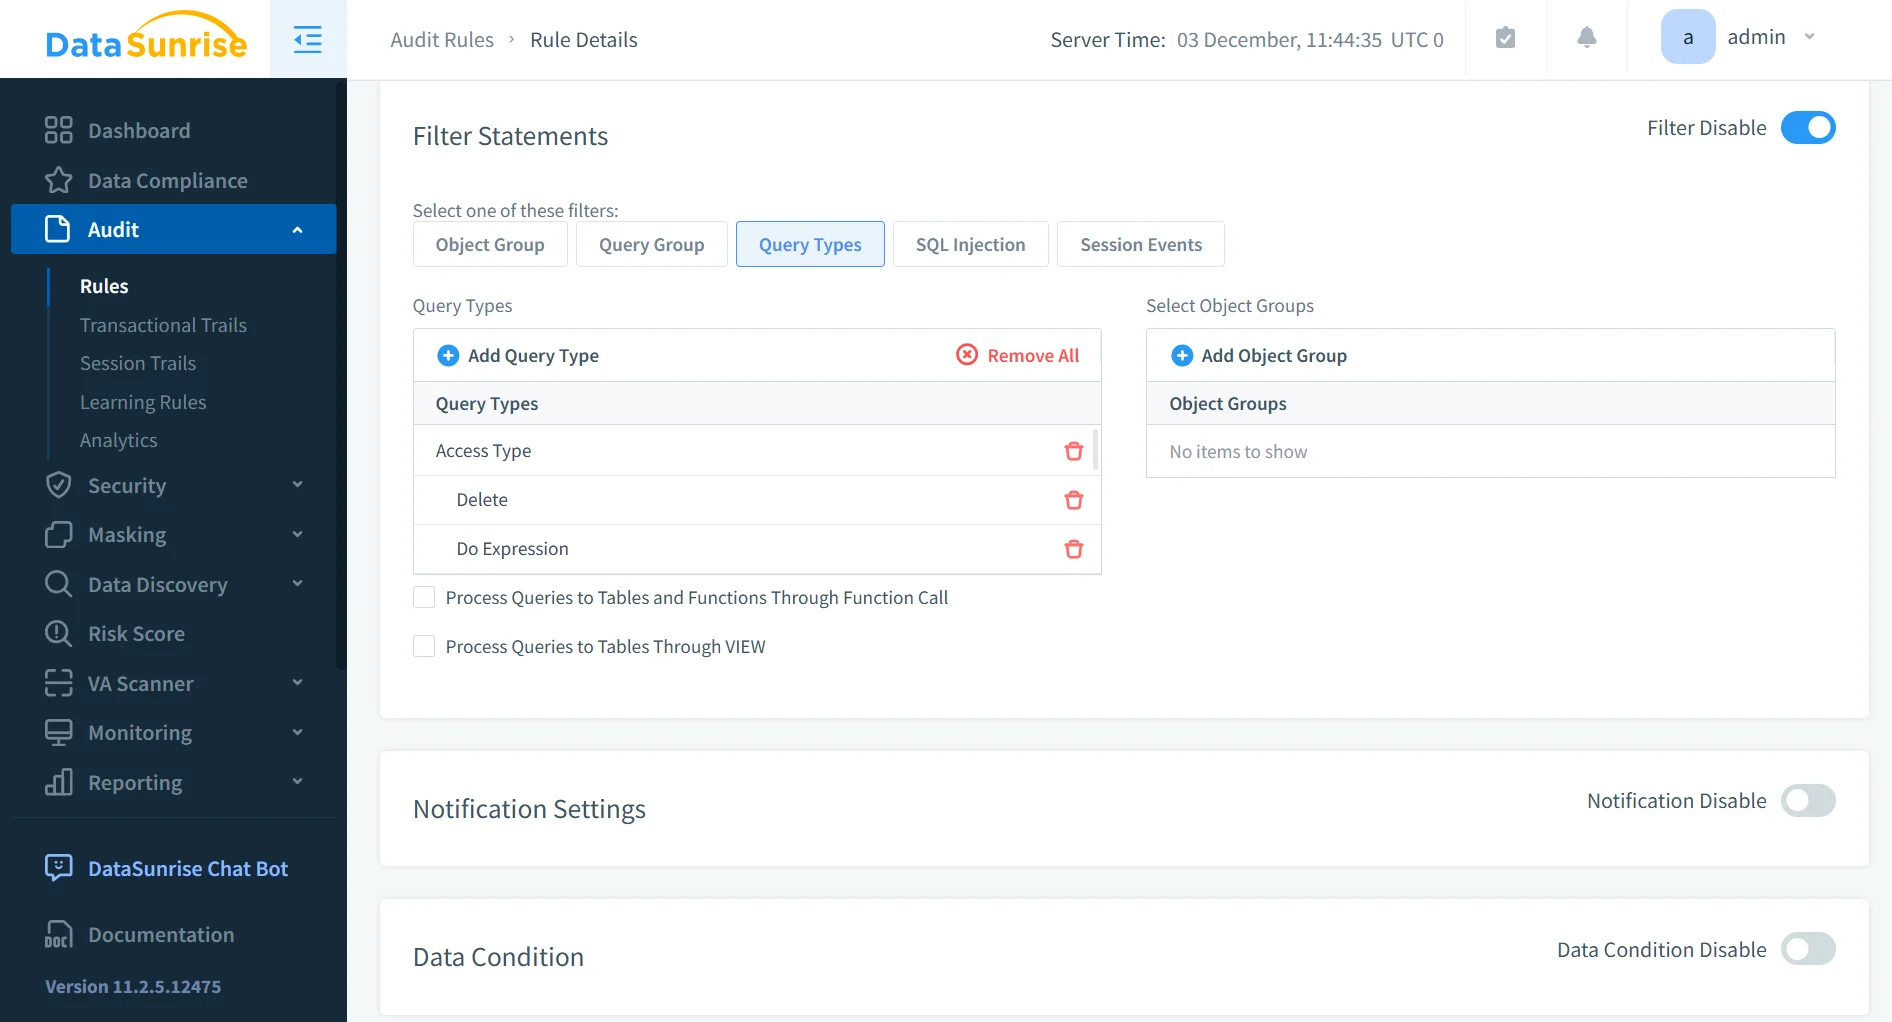
3. Granular, Rule-Based Monitoring
DataSunrise allows administrators to apply precisely scoped audit rules that target individual schemas, sensitive fields, high-risk users, or specific classes of operations. This minimizes noise, reduces storage consumption, and ensures compliance teams focus only on meaningful events.
Rules may be bound to regulatory requirements, internal governance policies, or dynamic risk scoring. Combined with automated sensitive-data discovery, this creates a tailored audit footprint that scales with organizational complexity.
For an overview of flexible rule models, see:
→ Audit Logs

4. Real-Time Threat & Behavior Detection
Traditional Redshift logging reacts after queries have executed, leaving security teams blind to emerging threats. DataSunrise introduces real-time UEBA-style behavioral analytics, continuously learning how legitimate workloads normally behave. Deviations — such as unexpected table scans, sudden privilege escalations, mass data extraction, or anomalous joins — trigger alerts instantly.
This proactive security layer identifies activity patterns that native Redshift tools cannot interpret, closing a major blind spot in cloud data warehouse security.
Behavior intelligence is described in detail at:
→ User Behavior Analysis
5. Compliance-Ready Audit Trails
DataSunrise transforms Redshift’s low-level operational logs into regulatory-grade audit trails, aligned with major compliance standards. Events are retained immutably, correlated globally across clusters, and enriched with context such as sensitivity level, user role, and policy relevance.
Organizations gain the ability to satisfy audit requests effortlessly, produce time-aligned evidence, and demonstrate strict governance controls across all Redshift workloads — something Redshift’s native telemetry cannot deliver alone.
Automated compliance alignment is covered here:
→ Compliance Manager

Key Advantages of DataSunrise
| Advantage | Description |
|---|---|
| Unified Activity Timeline | Eliminates Redshift’s fragmented STL/SVL logs by correlating all SQL, authentication, and metadata events into a single chronological history. |
| Deep Visibility into Sensitive Data Access | Identifies which queries accessed regulated or high-risk data, supported by classification metadata. |
| Behavior Analytics & Threat Detection | ML-driven anomaly detection flags deviations from typical workload and user behavior. |
| Granular Audit Controls | Rules can target specific objects, roles, operations, or compliance frameworks, reducing noise and focusing on critical activity. |
| Long-Term Retention & Immutability | Maintains audit trails far beyond Redshift’s STL retention window with tamper-resistant storage. |
| Cross-Cluster Correlation | Normalizes activity from multiple Redshift clusters, Serverless endpoints, and hybrid architectures into a unified governance layer. |
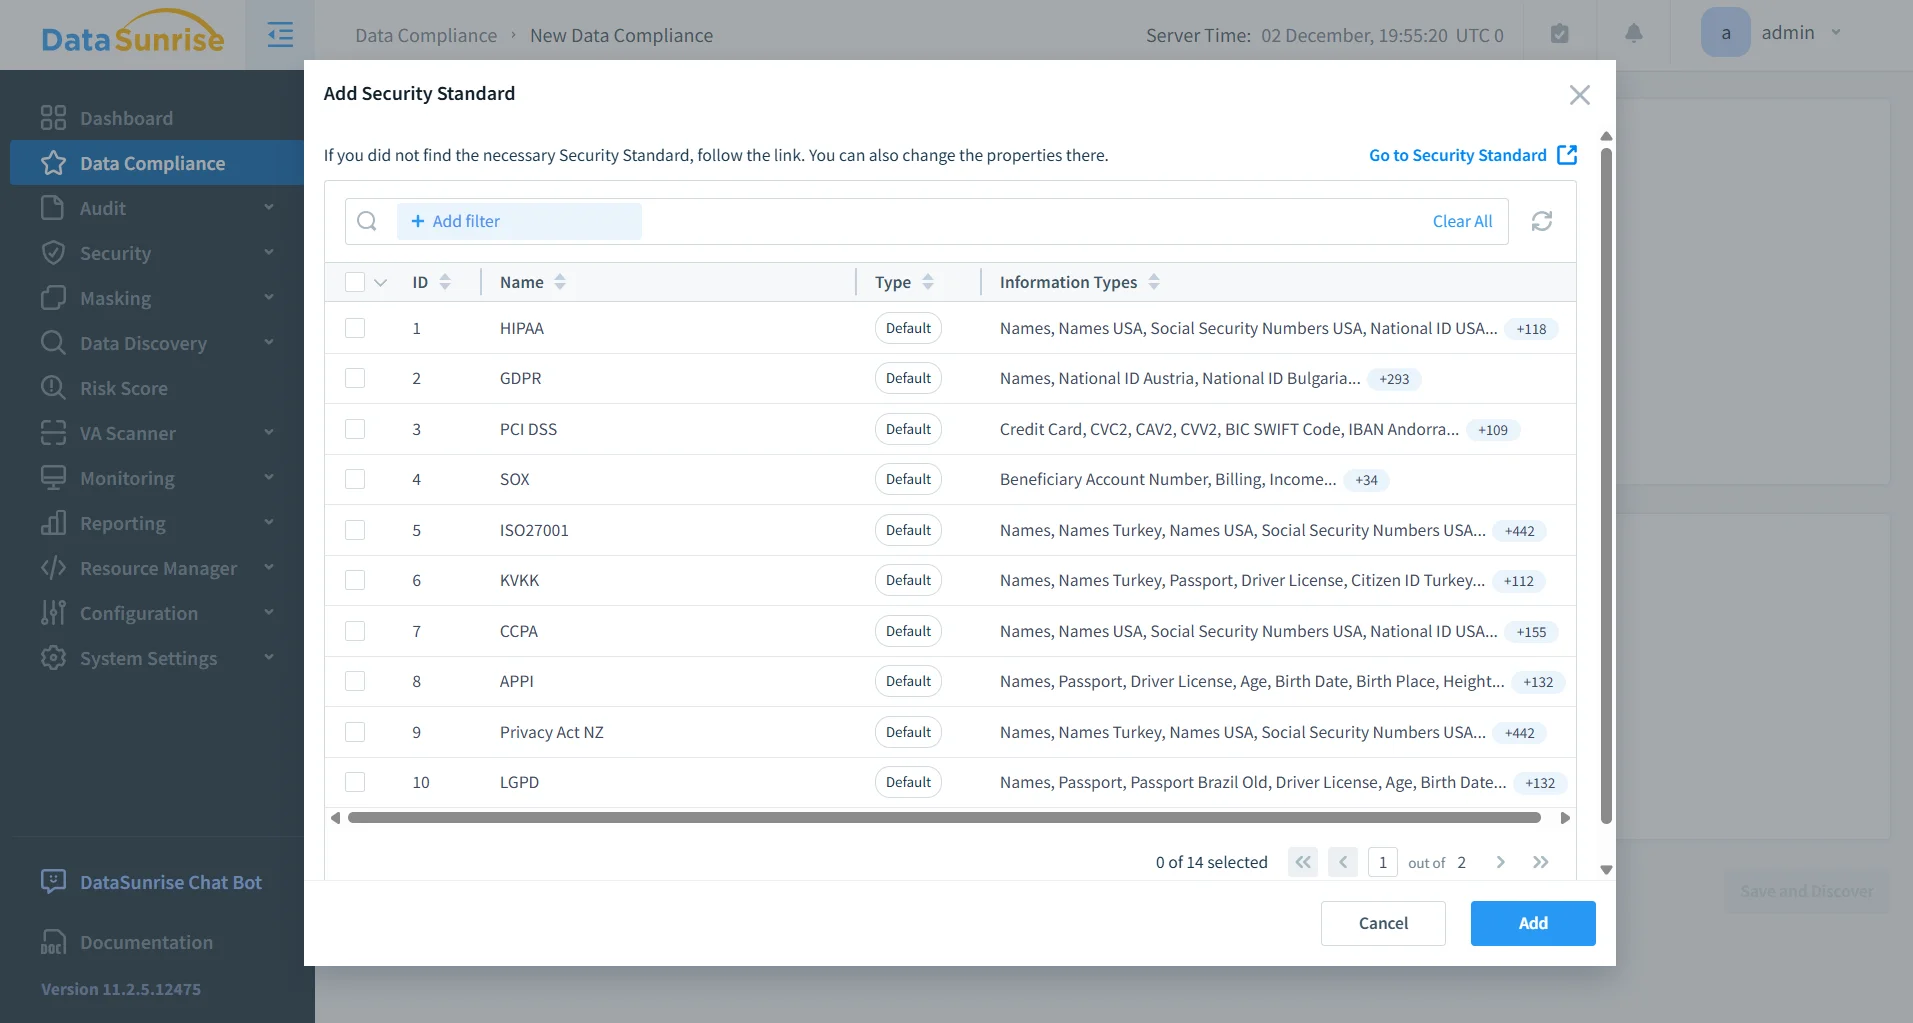
| Compliance Framework Mapping | Automatically annotates events with relevance to SOX, HIPAA, PCI DSS, GDPR, and internal governance policies. |
| Export-Ready Reporting | Generates auditor-grade exports in CSV, JSON, and PDF formats without manual log stitching. |
Conclusion
Amazon Redshift provides foundational telemetry, but its distributed architecture, node-local logs, and scattered system tables make it difficult to reconstruct a coherent activity history at scale. The native model forces engineers to manually correlate STL/SVL entries, CloudWatch streams, and WLM logs — each representing only fragments of the full execution picture. As a result, organizations struggle to achieve visibility that is chronological, complete, sensitive-data aware, and aligned with formal compliance frameworks. Without a unified activity timeline, critical tasks such as incident reconstruction, insider-threat detection, and sensitive-object governance require significant manual effort and are prone to gaps.
DataSunrise eliminates these limitations by aggregating, normalizing, and enriching all Redshift events into a single governed audit trail. Its proxy architecture captures contextual metadata that Redshift never exposes — including application identity, behavioral baselines, access-risk scoring, and cross-cluster correlation. The platform integrates sensitive-data discovery, automated policy enforcement, and dynamic monitoring to ensure that every action is attributed, ordered, and evaluable in real time. Combined with machine-learning-driven anomaly detection, DataSunrise transforms Redshift into an operationally transparent system suitable for regulated industries, long-term audit retention, and mission-critical data governance.
For extended visibility into structured audit pipelines, see the core architecture described in
→ Audit Trails
For visibility into object-level and session-level patterns, refer to
→ Database Activity History
For classification and handling of regulated information, review
→ PII & Sensitive Data Overview
For compliance alignment and automated evidence generation, see
→ DataSunrise Compliance Manager
Protect Your Data with DataSunrise
Secure your data across every layer with DataSunrise. Detect threats in real time with Activity Monitoring, Data Masking, and Database Firewall. Enforce Data Compliance, discover sensitive data, and protect workloads across 50+ supported cloud, on-prem, and AI system data source integrations.
Start protecting your critical data today
Request a Demo Download Now