Database Activity History

Introduction
Proactive monitoring of database activity has become a core component of modern cybersecurity strategy. It enables organizations to detect anomalies, policy violations, and suspicious user behavior before they develop into serious security incidents. By continuously examining query execution, access trends, and user actions, security teams gain the ability to uncover early signs of insider risks or compromised credentials. This level of visibility strengthens threat detection capabilities, supports consistent policy enforcement, and safeguards the integrity of mission-critical data systems.
Maintaining detailed logs of database operations further enhances operational stability and regulatory compliance. Comprehensive, time-stamped records reveal who accessed specific data assets, what operations were performed, and the circumstances surrounding each event. These insights are essential for incident response, forensic analysis, and ensuring traceability required by frameworks such as GDPR, HIPAA, and SOC 2. Beyond their security value, continuous monitoring tools help improve system efficiency by highlighting performance bottlenecks and abnormal workload patterns. Solutions like DataSunrise Activity Monitoring extend this visibility by delivering real-time oversight across the entire database environment.
According to research from Dtex Systems, 68% of insider risk events were mitigated through proactive approaches such as reinforced access controls, behavioral analytics, and targeted training programs. This highlights the critical role of continuous monitoring in improving security posture while fostering a culture of accountability and responsible data handling throughout the organization.
Data Compliance Overview | Regulatory Frameworks
What Database Activity History Records
In essence, database activity history refers to a chronological record of actions taken on a database system. These actions typically include:
- INSERT, UPDATE, and DELETE operations
- Schema or structural changes
- User session activity (logins and logouts)
- Executed SQL queries
- Changes to permissions and access attempts
These records serve multiple roles. During security audits, they help uncover gaps in access control. For forensic purposes, they provide a timestamped trail of every significant action. And in performance tuning, they highlight slow queries or problematic sessions.
Compliance frameworks such as HIPAA and GDPR require organizations to maintain activity logs for accountability and traceability.
Logging Table-Level Activity with PostgreSQL
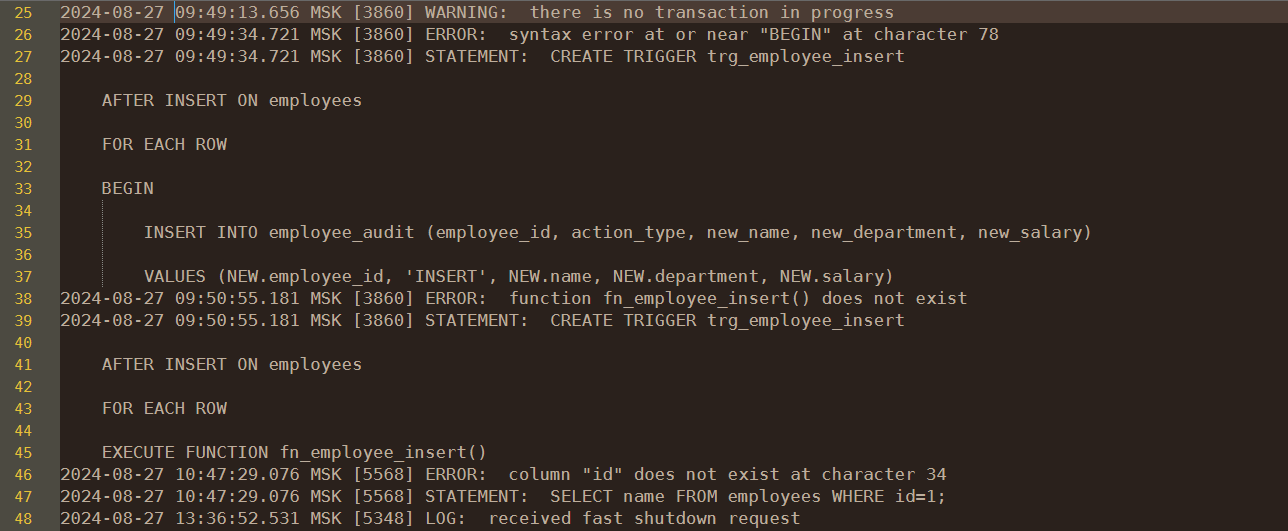
For row-level visibility, PostgreSQL allows teams to configure triggers on sensitive tables. Below is an example that captures detailed data operations:
# Enable pgAudit on PostgreSQL 16
psql -U postgres -c "CREATE EXTENSION IF NOT EXISTS pgaudit;"
psql -U postgres -c "ALTER SYSTEM SET shared_preload_libraries = 'pgaudit';"
psql -U postgres -c "ALTER SYSTEM SET pgaudit.log = 'read,write';"
sudo systemctl restart postgresql
Baseline audit before piping logs into DataSunrise.
-- PostgreSQL: Capture data activity on sensitive_table
CREATE TABLE data_activity_log (
  id SERIAL PRIMARY KEY,
  table_name TEXT,
  operation TEXT,
  user_name TEXT,
  old_data JSONB,
  new_data JSONB,
  activity_time TIMESTAMP DEFAULT current_timestamp
);

CREATE OR REPLACE FUNCTION log_data_activity()
RETURNS TRIGGER AS $$
BEGIN
  INSERT INTO data_activity_log(table_name, operation, user_name, old_data, new_data)
  VALUES (
    TG_TABLE_NAME,
    TG_OP,
    session_user,
    row_to_json(OLD),
    row_to_json(NEW)
  );
  RETURN NEW;
END;
$$ LANGUAGE plpgsql;

CREATE TRIGGER trg_data_activity
AFTER INSERT OR UPDATE OR DELETE ON sensitive_table
FOR EACH ROW EXECUTE FUNCTION log_data_activity();
This method works well for targeted monitoring. However, for enterprise-scale environments, it’s just one building block in a much larger strategy for managing database activity history.
Query to Retrieve Recent Activity (PostgreSQL Example)
-- View the 10 most recent operations from the activity log
SELECT
  id,
  table_name,
  operation,
  user_name,
  activity_time
FROM
  data_activity_log
ORDER BY
  activity_time DESC
LIMIT 10;
This query provides a quick snapshot of recent actions tracked by your custom PostgreSQL trigger. You can adapt the LIMIT or add filters to focus on a specific user or table.
Built-In Monitoring Features in Databases
Most modern DBMS platforms ship with logging capabilities that capture a baseline of system behavior. This usually includes executed queries, session events, and error tracking.
For instance, PostgreSQL logs are typically stored at:
C:\Program Files\PostgreSQL\14\data\log
/var/log/postgresql/postgresql-16-main.log
These native logs are helpful for routine diagnostics, but they lack advanced analytics. For organizations needing detailed reporting, compliance formatting, or real-time alerting, native tools usually fall short without custom configuration.
Latency impact by log volume
Database Activity History — Implementation Checklist
- Define scope: sensitive schemas/tables, privileged roles, success + failed attempts.
- Enable native logging (pgAudit / SQL Server Audit / MySQL audit plugin) with minimal noise.
- Create a normalized event schema (see below) and a single ingestion pipeline.
- Tag sensitivity (PII/PHI/PCI) at ingestion for priority alerting and reporting.
- Set alert rules: off-hours reads, mass SELECT on PII, role change → DDL, login failures spike.
- Export to SIEM and Database Activity Monitoring for correlation.
- Harden retention & integrity: rotation, compression, WORM/immutable store for evidence.
- Publish reports for GDPR, HIPAA, PCI DSS, SOX.
Standardized Audit Event Schema (for SIEM & Cross-DB Correlation)
Unifying logs across PostgreSQL, SQL Server, MySQL, and cloud engines starts with a consistent schema. Use the following field model to normalize native outputs before exporting to your SIEM or DataSunrise pipelines.
Example normalized event (JSON)
{
  "event_time": "2025-08-28T10:02:14Z",
  "actor": "app_reader",
  "role": "readonly",
  "client_ip": "203.0.113.24",
  "action": "select",
  "object": "public.customers",
  "statement": "SELECT * FROM customers WHERE id = ?",
  "status": "success",
  "rows_affected": 1,
  "sensitivity_tags": ["PII"],
  "session_id": "a9d2b4c1-58f0-4e2d-bc66-3d1f3a61e2a0",
  "engine": "postgres"
}
PostgreSQL: lightweight normalization view
-- Example: normalize native pgaudit lines into a standard schema
-- Assumes a staging table pgaudit_raw(line text)
CREATE OR REPLACE VIEW audit_normalized AS
SELECT
  (regexp_match(line, 'time=(.*?) '))[1]::timestamptz         AS event_time,
  (regexp_match(line, 'user=(.*?) '))[1]                       AS actor,
  (regexp_match(line, 'db=(.*?) '))[1]                         AS database,
  (regexp_match(line, 'client=(.*?) '))[1]                     AS client_ip,
  lower((regexp_match(line, 'ps=(.*?) '))[1])                  AS action,
  (regexp_match(line, 'obj=.*?(?:schema=(.*?); relname=(.*?);)'))[1] || '.' ||
  (regexp_match(line, 'obj=.*?(?:schema=(.*?); relname=(.*?);)'))[2] AS object,
  (regexp_match(line, 'statement=(.*)$'))[1]                   AS statement,
  CASE WHEN line LIKE '%denied%' THEN 'denied' ELSE 'success' END AS status,
  NULL::int                                                    AS rows_affected,
  NULL::text[]                                                 AS sensitivity_tags,
  (regexp_match(line, 'session=.*?(\\S+)'))[1]                 AS session_id,
  'postgres'                                                   AS engine
FROM pgaudit_raw;
Tip: Tag sensitivity (sensitivity_tags) at ingestion using DataSunrise discovery or existing data catalogs. This enables PII-aware alerting (e.g., bulk SELECT on PII → high severity) without brittle regex at query time.
Building Effective Database Activity History
Essential Checklist
- ✔ Capture user identity, roles, and session context
- ✔ Record all DML and DDL changes with timestamps
- ✔ Track failed logins and privilege escalation attempts
- ✔ Classify sensitive objects (PII, PHI, PCI) for high-priority alerts
- ✔ Store logs securely with rotation, retention, and integrity checks
Evolution Timeline
Why Many Organizations Look Beyond Native Logs
Out-of-the-box monitoring tools meet basic needs, but they often stop there. Real-time event correlation, intelligent filtering, and centralized dashboards typically require third-party platforms. Native logs are not designed to provide behavioral context, cross-database visibility, or automated threat scoring, which are essential for modern security teams that manage rapidly growing data ecosystems.
For example, a retail company using PostgreSQL might rely on log files to track failed login attempts. But without real-time alerts or session context, the team only spots brute-force activity during weekly log reviews—by then, the attack window has long passed. Even worse, without user attribution and query-level insight, it becomes extremely difficult to distinguish between legitimate batch processes, misconfigurations, and active intrusion attempts.
In addition, raw logs are difficult to search and can overwhelm teams with noise. Without normalization or built-in alerting, incident response becomes reactive rather than proactive. Many organizations also struggle with log retention and storage limits, meaning critical evidence may be overwritten before investigations begin. As environments expand across multiple clouds and distributed databases, these limitations make it clear why centralized, intelligent auditing solutions have become a necessity rather than an enhancement.
Setting Up Activity Monitoring in DataSunrise
For teams using DataSunrise, capturing database activity history is streamlined. Setup steps include:
- Log in to the DataSunrise console
- Navigate to “Instances” and select “+ Add New Database”
- Enter the required connection parameters
- Save and register the database
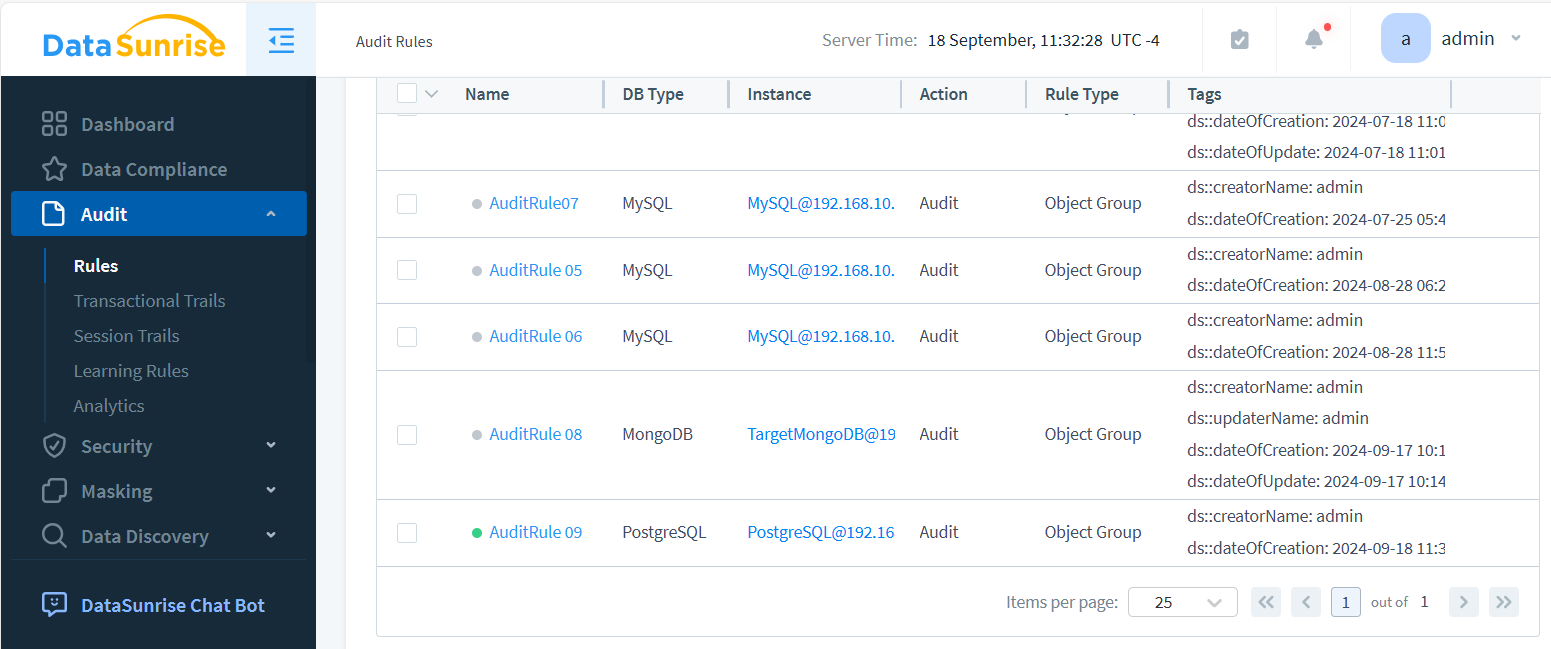
- Create and activate a new rule from the “Audit” section
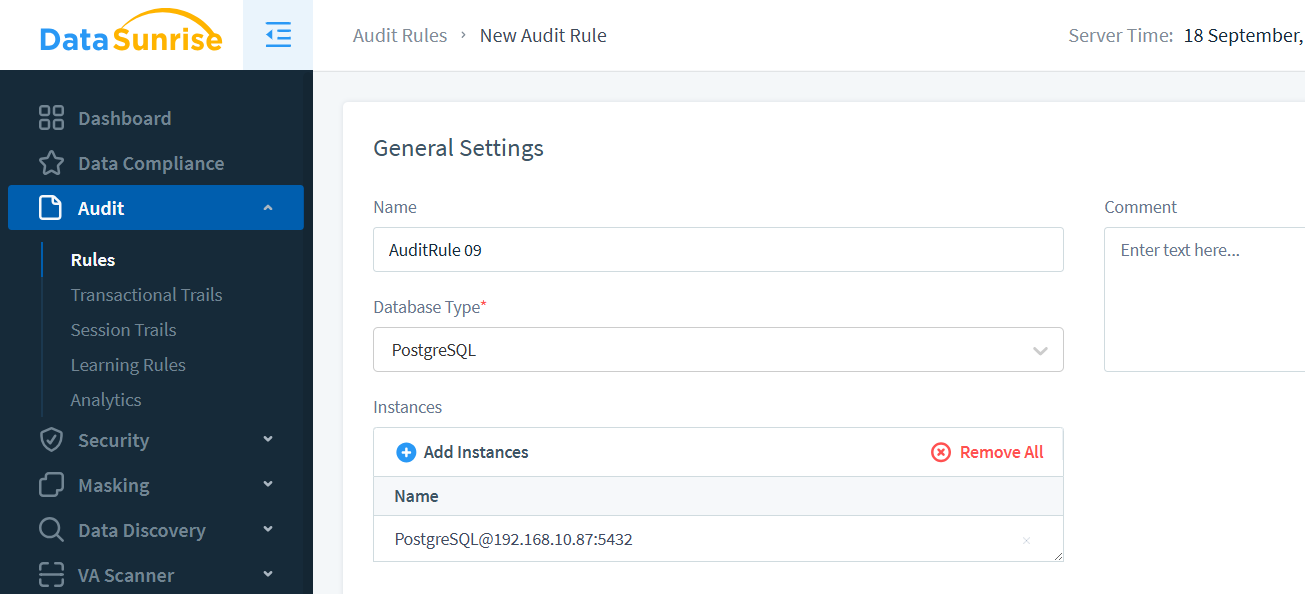
- Select the appropriate instance and define the logging timeframe
- View logs using the “Transactional Trails” tab

Benefits of DataSunrise for Logging and Security
DataSunrise enhances your tracking infrastructure with enterprise-grade features like:
- Central rule creation across heterogeneous environments
- Standardized logs from multiple database engines
- Advanced filters for faster incident analysis
- Real-time alerts triggered by rule violations
- Pre-built reports that align with industry regulations
# Ship DataSunrise trails straight to Splunk
curl -k https://splunk.example:8088/services/collector \
  -H "Authorization: Splunk $HEC_TOKEN" \
  -d '{"event":'"${JSON_PAYLOAD}"'}'
Cross-Database Activity History Example
Database administrators often face the challenge of pulling activity history across different platforms. Below is an example in SQL Server that retrieves recent audit records from a configured audit file:
-- SQL Server: Query recent audit events
SELECT
    event_time,
    server_principal_name,
    database_name,
    statement
FROM sys.fn_get_audit_file('C:\SQLAudits\*.sqlaudit', DEFAULT, DEFAULT)
WHERE event_time > DATEADD(HOUR, -1, GETDATE())
ORDER BY event_time DESC;
This approach works, but every DBMS has its own syntax, storage location, and filtering quirks. Managing multiple log formats quickly becomes cumbersome. This is where a unified platform like DataSunrise adds value—normalizing diverse audit sources into a single, searchable, and compliant activity history.
Unified Monitoring for Cloud and On-Prem
Whether your infrastructure runs on bare metal, in containers, or across multi-cloud environments, DataSunrise adapts. It provides a consistent view of your database activity history regardless of where your workloads live.
This unified model gives security and audit teams the full visibility they need to enforce policy and detect issues quickly.
Why Database Activity History Matters
Historical activity logs serve more than just compliance—they are essential for operational health and long-term risk reduction:
- Surface hidden risks and internal misuse
- Optimize queries and detect bottlenecks
- Generate structured compliance reports on demand
- Ensure traceability in case of a breach or incident
- Correlate user activity across applications and roles
Database Activity History FAQ
What is database activity history?
Database activity history is the chronological record of queries, logins, schema changes, and access attempts. It provides traceability for investigations, security monitoring, and compliance audits.
How is it different from standard logging?
Standard logs often capture errors and operational events. Activity history links actions directly to users and data objects, making it critical for accountability and regulatory reporting.
Which compliance frameworks require activity monitoring?
HIPAA, GDPR, PCI DSS, and SOX all require organizations to maintain user activity records. These frameworks emphasize traceability and accountability in data access.
Does activity logging impact performance?
- Minimal when scoped to sensitive tables and users.
- Higher volume logging can add latency, mitigated by rotation and offloading logs.
- Enterprise platforms like DataSunrise optimize collection to reduce overhead.
What are the key benefits of using a platform like DataSunrise?
- Centralized view of cross-database activity.
- Real-time alerts on suspicious access.
- Pre-configured compliance reports.
- Integration with SIEM and monitoring pipelines.
Industry Applications of Database Activity History
Different industries rely on activity history not just for visibility, but for survival under strict compliance mandates:
- Finance: Track account access and high-value transactions to satisfy SOX and PCI DSS, while reducing fraud exposure.
- Healthcare: Log every interaction with patient records to demonstrate HIPAA compliance and defend against insider misuse.
- Government: Provide auditors with transparent trails of policy enforcement across classified and public data sets.
- Retail & eCommerce: Correlate login failures and order modifications to protect PII and payment details under GDPR and PCI.
- SaaS Providers: Maintain tenant-level visibility to reassure customers that data segregation is intact and secure.
Framing database activity history in the context of real-world requirements makes it clear that logs are more than diagnostics—they are critical compliance and trust enablers.
Compliance Frameworks and Database Activity History
Maintaining database activity history is not only a best practice but an explicit requirement in many regulatory frameworks. Below is a mapping of how different standards address activity logging:
| Framework | Audit Requirement | DataSunrise Advantage |
|---|---|---|
| GDPR | Track access to personal data and provide evidence of lawful processing. | Granular rules on PII with automated reports for regulators. |
| HIPAA | Log every PHI access and modification for audit readiness. | Centralized trails with tamper-proof storage and PHI tagging. |
| PCI DSS | Monitor account data access and flag suspicious cardholder queries. | Real-time alerts and masking to safeguard PCI data in queries. |
| SOX | Ensure traceability of financial data changes and user accountability. | Auditor-ready reports showing who changed what, and when. |
By aligning activity history with these compliance requirements, DataSunrise reduces manual audit preparation, strengthens regulatory posture, and supports continuous monitoring.
Regulatory Drivers Behind Database Activity History
Auditors and regulators don’t just recommend that organizations maintain database activity logs—they require them as concrete proof of accountability and control. Across key frameworks such as GDPR, HIPAA, SOX, and PCI DSS, there is a strong mandate for full traceability of every interaction involving sensitive or mission-critical data. In practice, this means companies must be able to demonstrate not only who accessed protected resources, but also how efficiently they can identify irregular activity, generate alerts, and remediate incidents in real time.
Without a well-structured and continuously maintained record of activity, proving compliance during external audits becomes a major challenge—creating visibility gaps that auditors interpret as potential risks. By maintaining detailed, verifiable logs and connecting them to centralized oversight solutions such as DataSunrise, organizations can clearly demonstrate access governance, enforcement of internal policies, separation of duties, and effective incident response workflows. In this way, database activity history evolves from a simple logging tool into a strategic compliance asset—reducing regulatory exposure, preventing costly penalties, and reinforcing both operational integrity and organizational trust.
Conclusion
In the modern data landscape, maintaining complete and tamper-resistant records of database activity is not merely a best practice—it is a core compliance requirement. Within zero-trust environments and highly regulated industries, full visibility into every query, modification, and access event is critical to protecting sensitive information and meeting the obligations of GDPR, HIPAA, PCI DSS, and SOX. Traditional log systems often fall short by offering limited context, correlation, and responsiveness. In contrast, DataSunrise transforms raw logs into actionable intelligence that strengthens both cybersecurity and business continuity.
Through a unified approach combining advanced monitoring, behavioral analytics, and intelligent alerting, DataSunrise empowers organizations to instantly detect anomalies, trace every user action with accuracy, and maintain ongoing compliance across hybrid and multi-cloud infrastructures. Its centralized auditing engine aggregates diverse data sources, enabling security teams to uncover patterns, generate audit-ready reports, and identify vulnerabilities before they escalate.
Discover how DataSunrise transforms passive logging into proactive protection. Explore our interactive demo or visit the product overview to see how intelligent, automated auditing can strengthen your data security, compliance posture, and organizational resilience.
Protect Your Data with DataSunrise
Secure your data across every layer with DataSunrise. Detect threats in real time with Activity Monitoring, Data Masking, and Database Firewall. Enforce Data Compliance, discover sensitive data, and protect workloads across 50+ supported cloud, on-prem, and AI system data source integrations.
Start protecting your critical data today
Request a Demo Download NowNext