Databricks SQL Data Activity History
Databricks SQL is widely used as an analytical query layer in lakehouse architectures, supporting interactive analytics, dashboards, and automated reporting workloads. As these environments scale, organizations increasingly need visibility not only into individual queries, but into the full history of how data is accessed over time. This is where a Databricks SQL data activity history becomes essential.
A data activity history provides a continuous, chronological record of interactions with data objects. Instead of focusing on isolated audit events, it shows how tables and datasets are accessed repeatedly, how usage patterns evolve, and which users or applications interact with sensitive data most frequently.
This article explains what data activity history means in the context of Databricks SQL, how native logging supports basic visibility, and how DataSunrise builds a centralized, enriched activity history using real-time monitoring and transactional records.
What Is Data Activity History in Databricks SQL?
Databricks SQL data activity history is a structured timeline of data access events. It records which SQL statements were executed, which tables or schemas were touched, when the activity occurred, and who initiated it. Over time, this information forms a behavioral picture of how data is actually used.
Unlike a traditional audit trail that focuses on compliance checkpoints, data activity history emphasizes continuity. It allows teams to observe recurring access patterns, detect unusual spikes in activity, and understand long-term trends across users, roles, and applications.
This perspective is particularly important for organizations managing regulated data under frameworks such as GDPR, HIPAA, PCI DSS, and SOX, where ongoing visibility matters as much as point-in-time audits.
Native Databricks SQL Data Activity Visibility
Databricks provides native logging that captures SQL execution events and workspace activity. These logs typically include query text, timestamps, and user identifiers. Many teams rely on this telemetry as a starting point for understanding data usage.
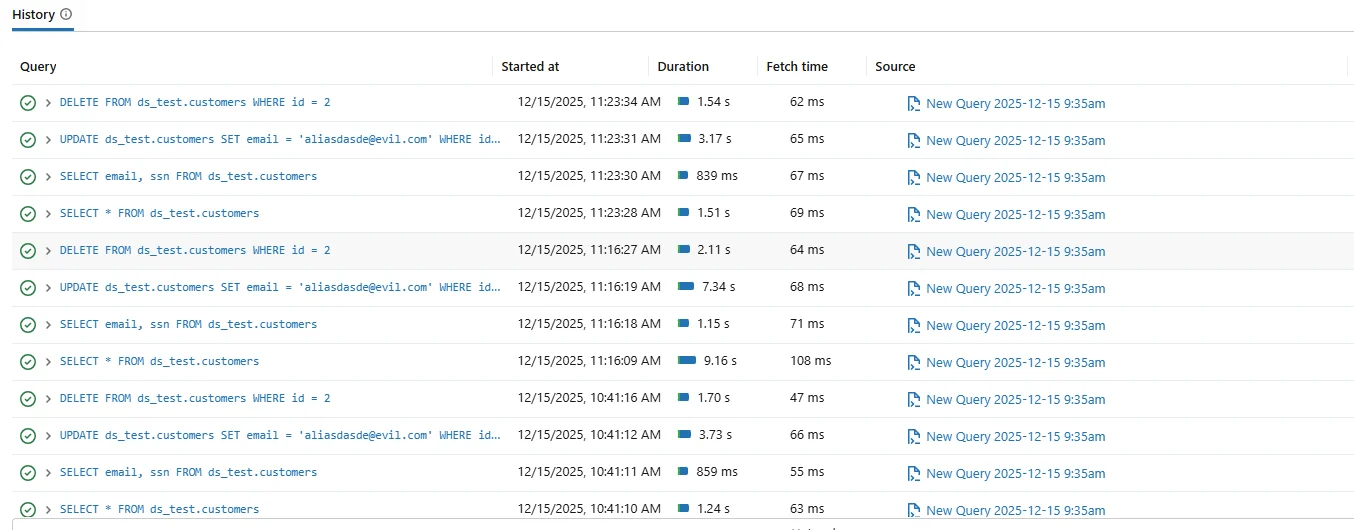
Native Databricks SQL history view showing executed queries and basic activity metadata.
While native logs offer basic insight, they are not designed to present a consolidated data activity history. Logs are often scattered across systems and exported to external platforms such as Azure Log Analytics or Amazon CloudWatch.
As a result, reconstructing long-term data access patterns typically requires manual aggregation, custom queries, or third-party tooling.
Why Data Activity History Matters Beyond Auditing
A data activity history serves multiple purposes beyond compliance. Security teams use it to detect unusual behavior, such as unexpected access to sensitive tables. Data owners rely on it to understand how datasets are actually consumed across the organization.
From a governance perspective, activity history helps validate access controls and supports the principle of least privilege. If certain users or applications never access specific data, access policies can be refined accordingly.
Without a centralized activity history, these insights remain hidden inside fragmented logs.
Capturing Databricks SQL Activity with DataSunrise
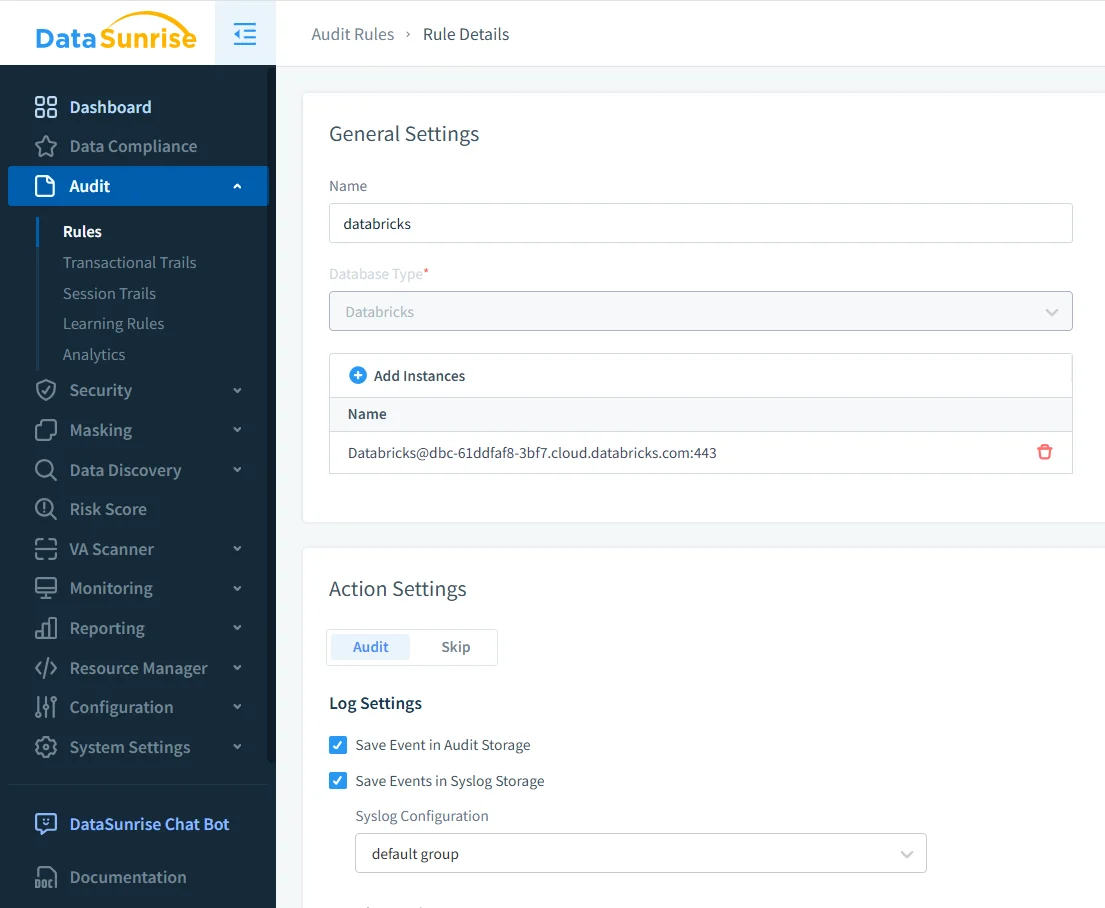
DataSunrise captures Databricks SQL activity in real time by establishing a secure connection to the SQL warehouse. This connection allows the platform to observe queries as they execute, without disrupting analytical workloads.
Configuring a Databricks SQL connection in DataSunrise to enable data activity history collection.
During configuration, administrators specify connection parameters such as hostname, port, warehouse name, and authentication method. Once connected, DataSunrise begins collecting activity data continuously.
This real-time capture forms the foundation of a reliable data activity history, ensuring that no meaningful interactions are missed.
Filtering and Structuring Activity History
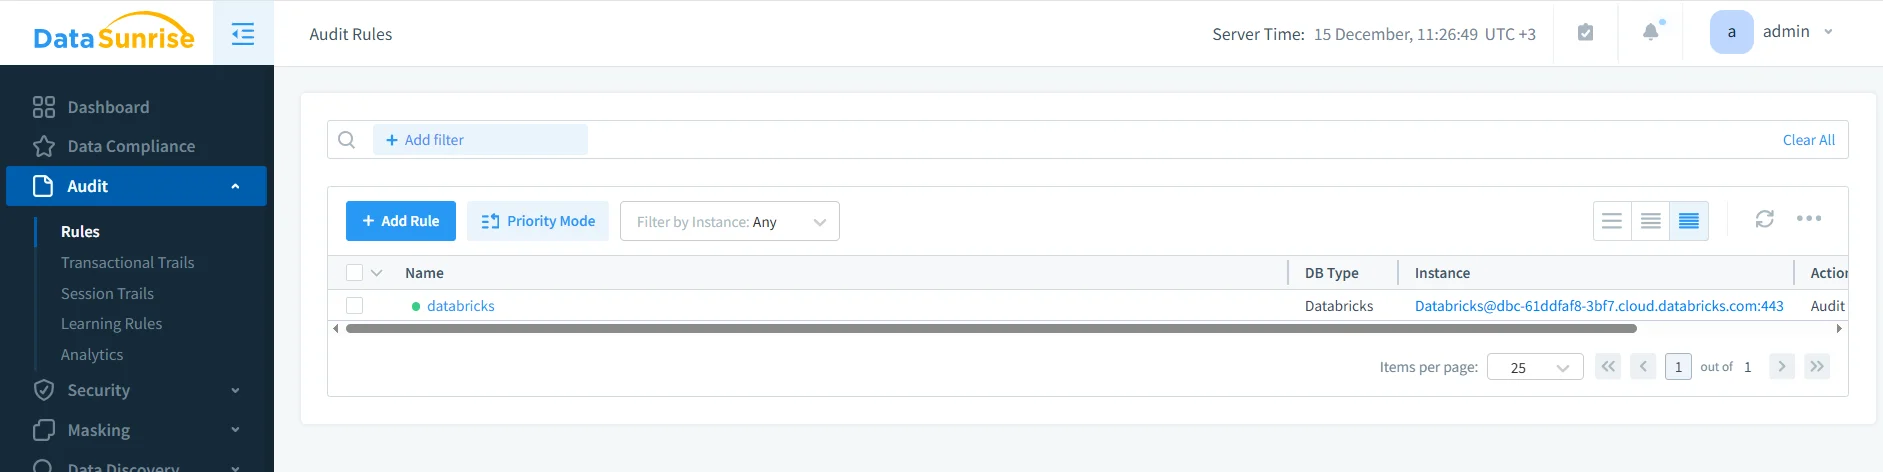
Not all activity is equally important. DataSunrise allows teams to define audit rules that determine which operations and data objects should be included in the activity history.
Defining audit rules to filter Databricks SQL activity based on query types and data objects.
By focusing on specific schemas, tables, or query types, organizations can build an activity history that highlights meaningful data usage while reducing noise. This approach aligns with best practices described in data activity history and database activity history.
Transactional View of Data Activity
Once rules are active, DataSunrise records activity in a transactional history. This view preserves the chronological order of SQL operations, allowing teams to follow how data access unfolds over time.
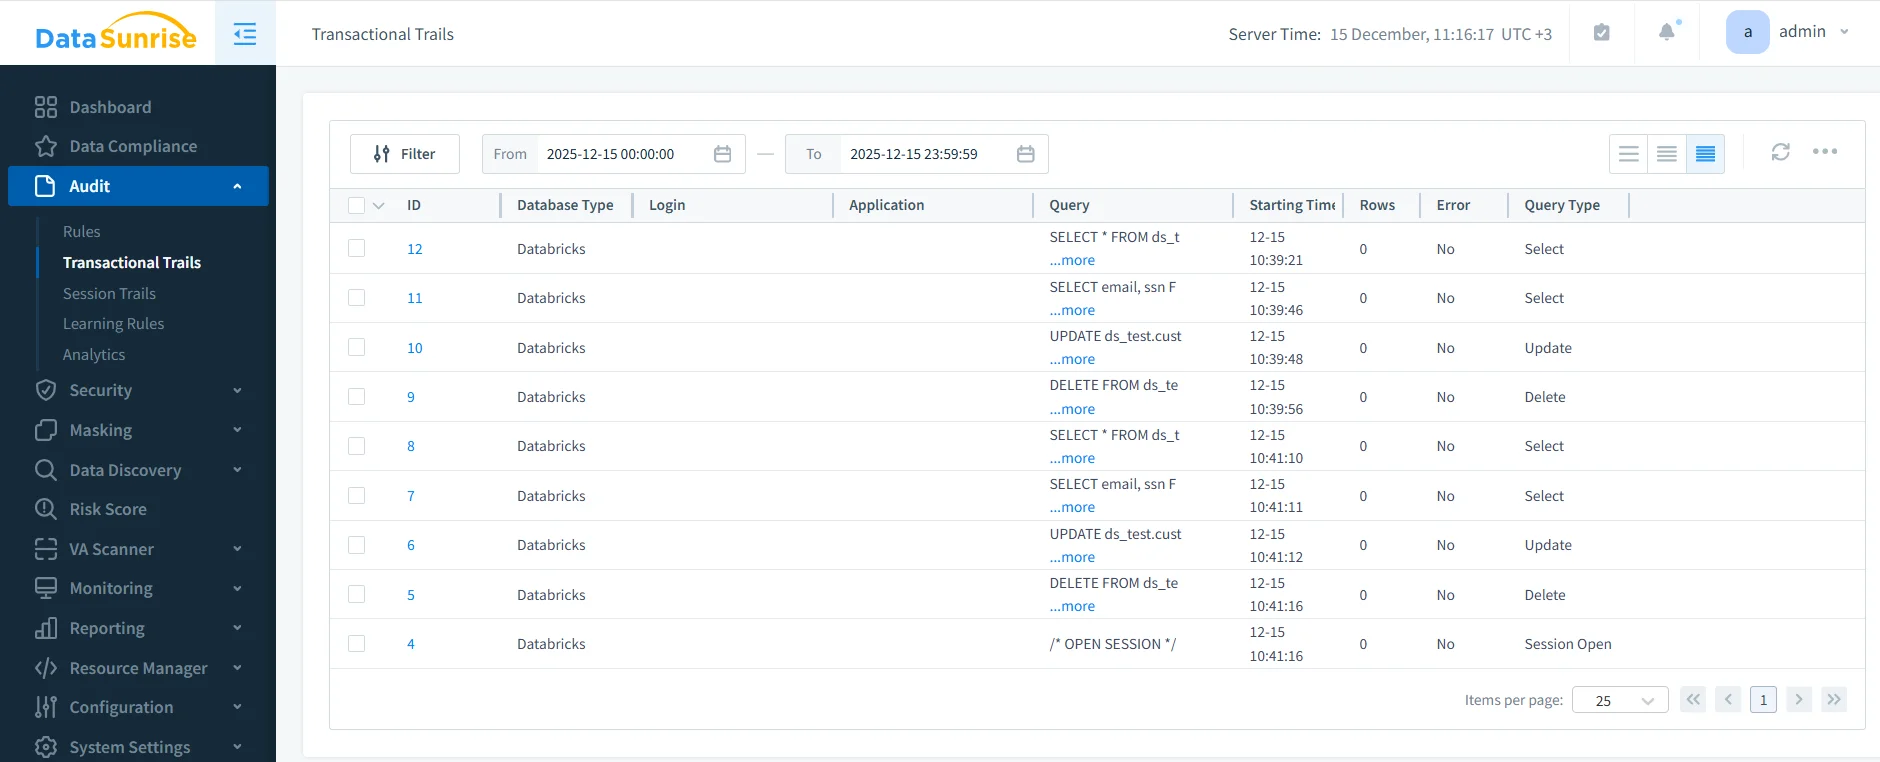
SELECT, UPDATE, and DELETE operations in Databricks SQL.
Each record includes query text, execution time, query type, session identifier, and execution status. Together, these details provide a complete picture of how datasets are accessed and modified.
This structured history supports investigations, usage analysis, and compliance reporting, while also enabling behavior analytics.
Native Logs vs Centralized Data Activity History
| Capability | Native Databricks Logs | DataSunrise Activity History |
|---|---|---|
| Long-term visibility | Fragmented | Centralized and continuous |
| Data object context | Limited | Schema- and table-level tracking |
| Event correlation | Manual | Automatic session-based correlation |
| Behavior analysis | Not available | Built-in support |
| Compliance reporting | Custom processing | Automated evidence generation |
Governance and Compliance Use Cases
A Databricks SQL data activity history supports both security operations and governance workflows. Security teams use it to investigate unusual access patterns, while compliance teams rely on it to demonstrate ongoing oversight.
By integrating activity history with database activity monitoring and data compliance capabilities, organizations reduce audit preparation time and improve response to incidents.
This unified visibility ensures that data access remains transparent, traceable, and defensible over time.
Conclusion: Building Databricks SQL Data Activity History
Databricks SQL enables flexible analytics, but modern data governance requires more than isolated logs. A complete data activity history must capture behavior over time, preserve context, and support both operational and regulatory needs.
A Databricks SQL data activity history built with DataSunrise provides continuous visibility into data usage, helping organizations detect risks, understand access patterns, and meet compliance obligations.
With a centralized activity history in place, teams can confidently scale Databricks SQL while maintaining control, transparency, and regulatory alignment.
Protect Your Data with DataSunrise
Secure your data across every layer with DataSunrise. Detect threats in real time with Activity Monitoring, Data Masking, and Database Firewall. Enforce Data Compliance, discover sensitive data, and protect workloads across 50+ supported cloud, on-prem, and AI system data source integrations.
Start protecting your critical data today
Request a Demo Download Now