Database Audit for Vertica
Why Database Audit Matters for Vertica Clusters
Vertica often acts as the analytical core of a company, and a robust database audit for Vertica is critical when it powers reporting data marts, executive dashboards, and heavy ad-hoc analytics. These workloads typically include financial metrics, customer behavior data, operational logs, and aggregated events from dozens of systems. Additionally, Vertica is commonly deployed as part of wider analytics platforms such as the Vertica Analytics Platform, which further increases the importance of reliable auditing.
When something goes wrong data leakage through a report, a suspicious export, or mistakes by a privileged user you need to quickly and confidently answer three questions:
- who accessed the database,
- which objects and queries they used,
- whether this activity was acceptable under access policies and regulations.
A strong Vertica database audit solves exactly this problem. Vertica itself provides part of the picture, but for security and compliance that is usually not enough. Therefore, it makes sense to add an external audit layer on top of native logs—for example, via DataSunrise Activity Monitoring, which normalizes events, enriches them with context, and turns them into reports for audits and investigations.
To embed Vertica into a broader data protection strategy, it is also useful to rely on general materials about data compliance and regulatory requirements. As a result, the database audit story becomes part of a consistent governance framework instead of an isolated DBA task.
Native Database Audit Capabilities in Vertica
Vertica logs what happens inside the cluster quite well. The main elements of native audit are:
- Data Collector – an internal mechanism that gathers session and query statistics.
v_monitorschema views – query history, statuses, errors, and timing details, including thev_monitor.query_requestsview.- Additional diagnostic functions and log files that DBAs use for troubleshooting and performance analysis.
From an audit perspective, this provides a reliable “raw” source of truth for Vertica: by using system views you can reconstruct query history on a particular cluster. In many environments this is where database audit for Vertica starts.
Data Collector and Monitoring Snapshot
The Data Collector is enabled by default and continuously feeds Vertica’s monitoring views with fresh information about sessions and requests. As long as it stays active, administrators can look back in time and see how workloads behaved and which users were active. Disabling the Data Collector for long periods creates blind spots in that history, so in production environments it is typically left enabled.
In practice, this means that Vertica already stores a rich audit signal without additional configuration. However, this signal is still local to each cluster and presented in a very technical form.
How Vertica Exposes Query History
The key view used for auditing queries is v_monitor.query_requests. Each row corresponds to one user request and includes:
- the database user who executed it,
- the request type (for example, QUERY, DDL, LOAD),
- a compact snippet of the SQL text,
- timestamps and duration,
- a success flag and error counters.
By filtering this view by user, schema, request type, or time window, DBAs can quickly reconstruct “who ran what and when” inside a specific Vertica cluster. For example, they can focus on all DDL statements over the last hour or all queries executed by a particular application account.
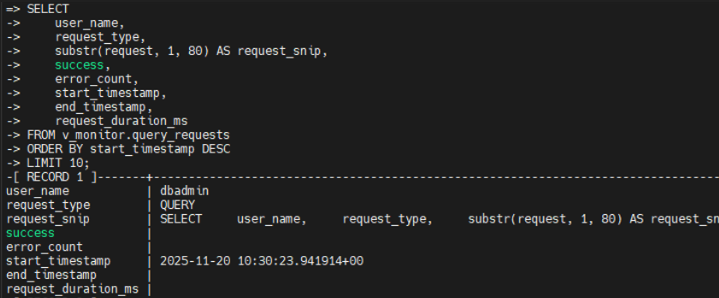
v_monitor.query_requests, displaying recent queries with user name, request type, timestamps, and success status.
This native audit layer is the baseline that most security and compliance workflows rely on. Together, these native capabilities give DBAs a reliable internal history of what happened on a single Vertica cluster. However, security and compliance teams usually need a broader view that spans multiple clusters, applications, and systems. That is where an external database audit layer comes in.
Reference Architecture for Database Audit in Vertica
For a Vertica audit program to work not only for DBAs but also for security and compliance teams, the simple pattern “admin runs a query against v_monitor” is not enough. In practice, a more stable approach is to have a dedicated audit layer around Vertica.
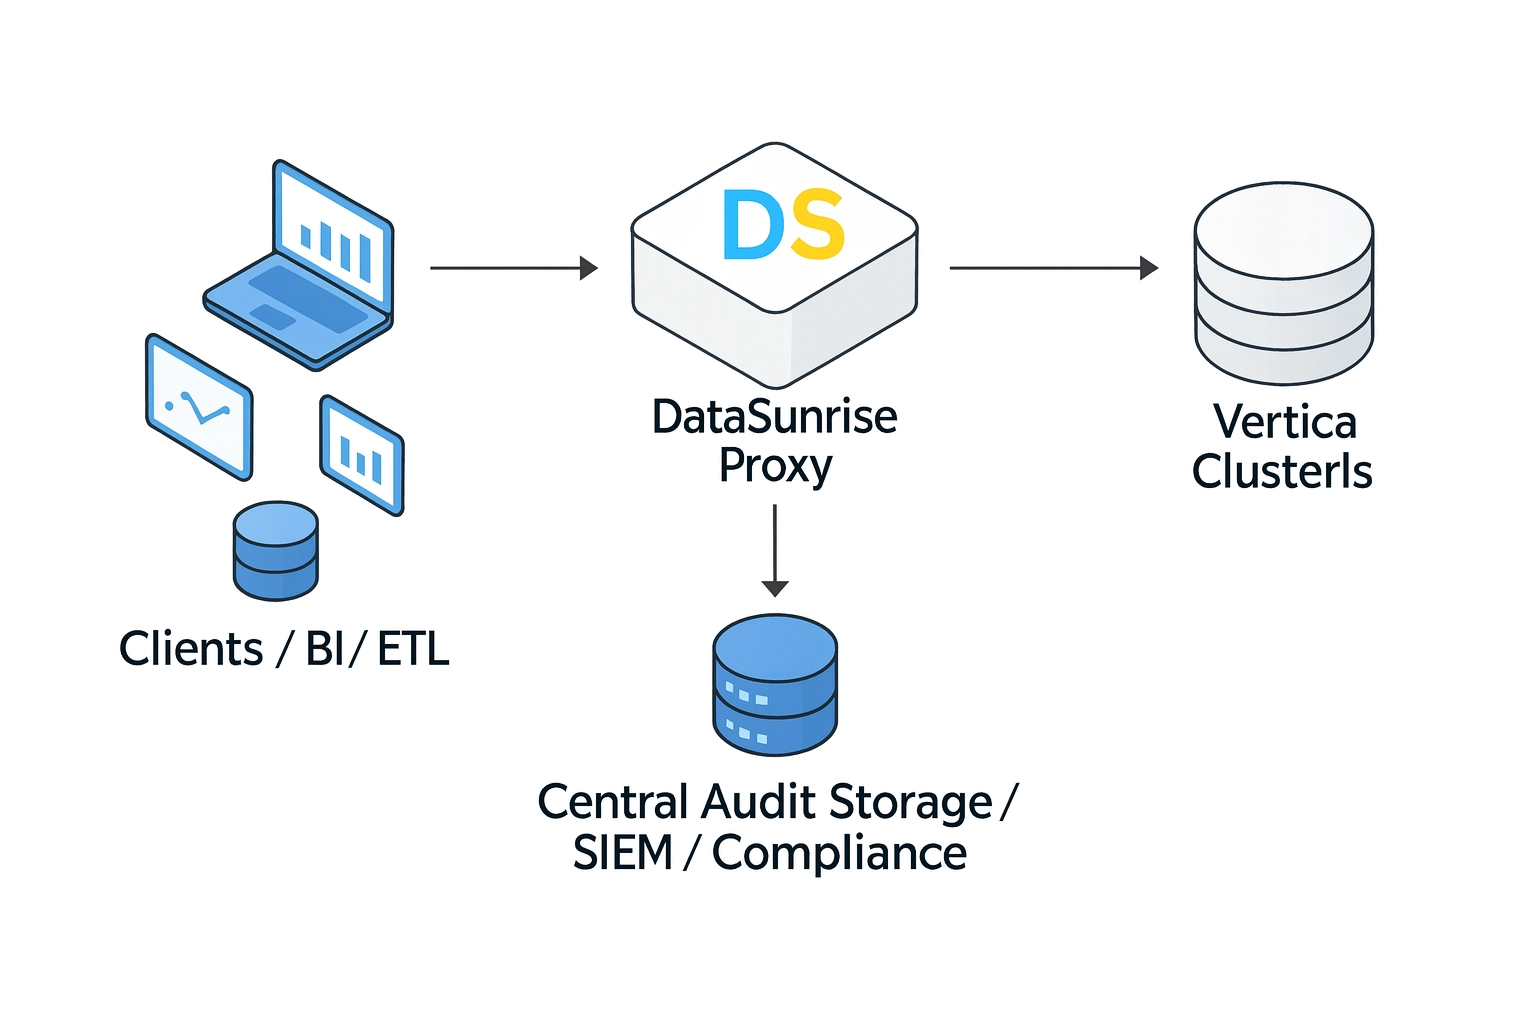
A typical architecture looks like this:
- Clients and BI tools (reporting, ETL, analytics) connect not directly to Vertica but to a DataSunrise proxy endpoint.
- The DataSunrise Proxy receives queries, analyzes them, optionally applies security rules, and then forwards them to Vertica.
- Vertica clusters (prod, stage, regional) execute the queries as usual.
- The DataSunrise audit repository stores normalized events: who, from where, which query, against which schema, with what result.
- When needed, events are sent to SIEM/SOAR systems and the Compliance Manager module for regulatory reporting.
This configuration provides several advantages:
- The audit log is stored outside Vertica, so it is harder to lose it in case of a cluster failure.
- You can audit multiple Vertica clusters and other databases in a consistent way.
- Policies can be defined at the level of “who accesses which data,” not just “which SQL text appears in
v_monitor.” - Additionally, incident responders and auditors can work with audit data without loading production Vertica clusters.
Example: Vertica Audit View in DataSunrise
Once this architecture is in place, every Vertica statement that passes through the DataSunrise proxy appears in a centralized audit view. Security analysts can filter by rule, database type, query text, time range, or error status and quickly drill down into suspicious activity.
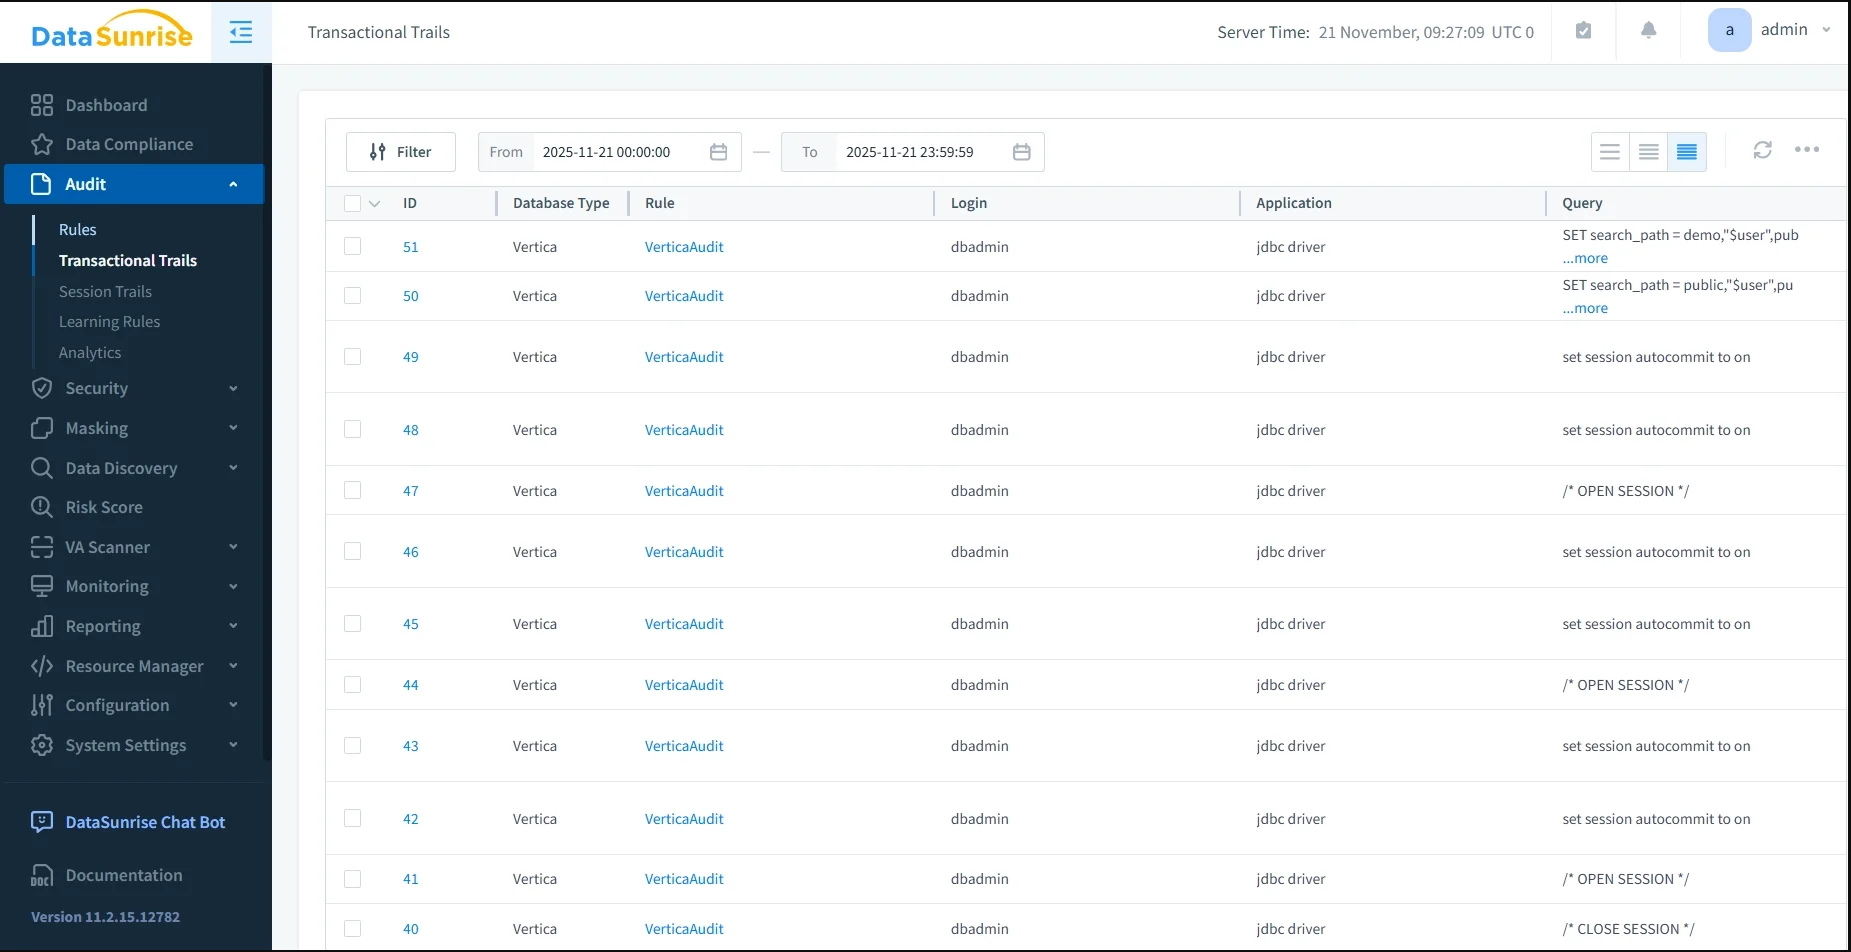
In the Audit → Transactional Trails page, each row represents a single request, including:
- ID and database type (Vertica),
- the audit rule that captured the event,
- query text or its shortened form,
- starting time and execution duration,
- row count, error flag, and query type.
This is the practical representation of the architecture described above—the place where security teams and auditors actually work with Vertica database audit trails. Instead of assembling evidence from multiple clusters and ad-hoc SQL queries, they can use a single, normalized view.
With this centralized view in place, it becomes easier to see how native Vertica logs and DataSunrise complement each other rather than compete. The table below summarizes their roles side by side.
Comparing Native Vertica Logs and DataSunrise Audit
Native Vertica logging and external audit via DataSunrise solve different parts of the problem. Together they provide the complete picture of database audit for Vertica.
| Aspect | Native Vertica Logs | Database Audit with DataSunrise |
|---|---|---|
| Visibility | Query history inside a single cluster (v_monitor, log files). |
Centralized audit across all Vertica clusters and other databases. |
| Context | DB user, SQL text, time, counters. | DB user, mapped identity, application, IP, audit rule, and risk level. |
| Policies | Custom SQL scripts and filters. | Rules by users, roles, schemas, operation types, and data sensitivity levels. |
| Reporting & Compliance | Manual exports and one-off reports on request from auditors. | Built-in reports, long-term retention, alignment with GDPR, HIPAA, PCI DSS, SOX, and internal policies. |
| Integration with other systems | Local to Vertica; integrations must be developed separately. | Event streaming to SIEM/SOAR, ticketing systems, and Compliance Manager without app changes. |
The native layer is needed as the cluster’s “black box”: it shows what Vertica actually executed. In contrast, DataSunrise builds on top of this a management and analytics layer with policies, alerts, and centralized visibility, which is more useful for ongoing governance.
Key Use Cases for Database Audit in Vertica
From a business and compliance point of view, database audit for Vertica is typically used in several scenarios:
- Regular access reviews. Who accesses tables with personal data, payment information, or trade secrets, and how often.
- Incident investigations. A suspicious report, export, or data leak requires reconstructing the chain of queries and users.
- Third-party and contractor control. Separate audit rules and alerts for service accounts, temporary users, and external analytics partners.
- Audit and certification preparation. Building an evidence base for GDPR, HIPAA, PCI DSS, SOX, and internal policies: who worked with critical data, when, and under what authorization.
- Unified control in hybrid environments. When Vertica coexists with PostgreSQL, cloud warehouses, and NoSQL services, a single database audit layer is preferable to custom scripts for each technology.
For example, an organization might use native Vertica views for low-level troubleshooting, while DataSunrise provides high-level dashboards and reports for auditors and security teams.
Getting Started with Database Audit for Vertica and DataSunrise
It makes sense to implement database audit for Vertica step by step:
- Classify the data. Identify Vertica clusters, schemas, and tables that contain PII, financial data, and other sensitive datasets. If needed, use Sensitive Data Discovery to automatically locate and label sensitive records before you design audit rules.
- Deploy DataSunrise in front of Vertica. Follow the proxy-based architecture described above: choose proxy or sniffer mode, configure applications to connect through DataSunrise, and verify that queries pass transparently. For practical deployment patterns see Deployment Modes of DataSunrise.
- Create baseline audit rules. Start with broad “log all operations” rules and additional rules for sensitive schemas. Then refine coverage based on real compliance requirements and feedback from security teams. The Audit Guide provides a good reference when designing Vertica-specific audit policies.
- Enable reporting and alerts. Integrate with SIEM, enable reporting, and align with the security team on which events count as incidents so that alerts are meaningful rather than noisy. Centralized dashboards and compliance reports are available in DataSunrise Compliance Manager.
- Review policies regularly. As new data sources and services appear, revise audit rules to avoid blind spots and keep the Vertica audit setup aligned with evolving regulations. Ongoing monitoring with Database Activity Monitoring helps ensure that policies remain effective over time.
Conclusion
Vertica’s native tools provide a solid foundation: the Data Collector, v_monitor views, and related diagnostics let you see what happened inside a particular cluster. However, a full-scale database audit for Vertica requires more than queries against internal tables. You need a unified layer that connects individual clusters, applications, users, and access policies into a single picture.
The combination of Vertica and DataSunrise addresses this need. Vertica remains a fast analytical engine and a source of “raw” facts, while DataSunrise turns those facts into a centralized audit log, policies, reports, and alerts. As a result, organizations get more than a query log—they get a managed audit process that helps pass inspections, reduce risk, and work more transparently with sensitive data.
For a broader overview of database auditing concepts and common patterns, you can also review the Data Audit article in the DataSunrise Knowledge Center.
If you need a deeper, Vertica-focused walkthrough with native SQL examples and screenshots of built-in monitoring views, see the related article Data Audit for Vertica. It complements this architecture-focused overview with more low-level details.
Protect Your Data with DataSunrise
Secure your data across every layer with DataSunrise. Detect threats in real time with Activity Monitoring, Data Masking, and Database Firewall. Enforce Data Compliance, discover sensitive data, and protect workloads across 50+ supported cloud, on-prem, and AI system data source integrations.
Start protecting your critical data today
Request a Demo Download Now