How to Audit Vertica
Auditing Vertica is more than flipping a logging switch. To understand who accessed the database, which SQL statements they executed, and how those actions affected data, you need both Vertica’s native monitoring views and a centralized place to store and analyze those events. This guide shows a practical workflow: first using v_monitor to collect native evidence, then using DataSunrise Data Audit to build a complete Vertica audit trail.
We will reference related topics such as Audit Logs, Database Activity Monitoring, and Compliance Manager. For engine-level configuration and catalog details, the official Vertica documentation remains the authoritative source.
Step 1 – Inspect Native Vertica Audit Sources
Vertica stores activity history in its v_monitor schema and engine log files. These views are not labeled “audit,” but they contain most of the information needed to reconstruct what happened:
v_monitor.query_requests– one row per request, including user name, request type, SQL text, timestamps, and success flag.v_monitor.sessions– session metadata such as session ID, client host, and login time.- Engine log files – authentication attempts, errors, and engine warnings written to Vertica’s log directory.
You can inspect this data directly in DBeaver by running a basic query:
SELECT *
FROM v_monitor.query_requests
ORDER BY start_timestamp DESC
LIMIT 100;
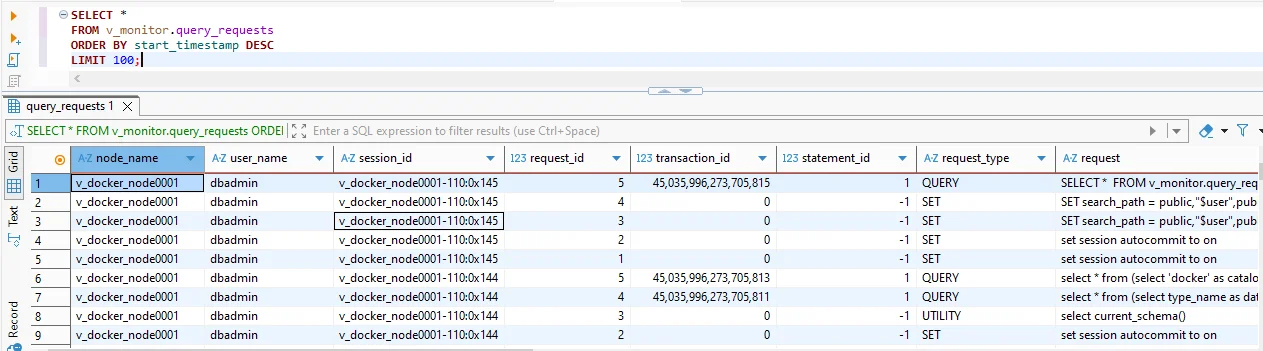
Native Vertica history from v_monitor.query_requests in DBeaver. Each row identifies the node, user, session, request type, and SQL text, giving you a baseline audit view.
This approach already answers many audit questions: which users executed which statements and when. However, if you run multiple clusters, or if you need to keep audit data for months or years, manually querying v_monitor and copying results out of DBeaver is hard to sustain. The next steps show how to move from raw logs to a structured Vertica audit workflow.
Step 2 – Identify Gaps in Native Vertica Auditing
Before adding more tooling, it helps to be clear about where native auditing falls short:
- Cluster-local view. Queries against
v_monitoronly show what happened on a single cluster. You must connect to each environment separately. - Limited retention. History is bound by disk and configuration. Old records disappear as tables are cleaned up and log files rotate.
- No policy abstraction. Vertica faithfully records what happened, but it does not provide rule-based audit policies such as “log all DDL in schema finance.”
- Manual export and correlation. To feed SIEM or reporting systems, you must write your own exports, merge logs from multiple nodes, and normalize formats.
To move from ad-hoc inspection to repeatable auditing, most teams add a dedicated layer that can capture SQL in real time, apply audit rules, and store events in a central repository.
Step 3 – Introduce DataSunrise as the Vertica Audit Layer
DataSunrise Activity Monitoring complements Vertica by capturing SQL traffic on the way to the database. Deployed in proxy mode, applications connect through DataSunrise; in sniffer mode, DataSunrise listens to mirrored traffic. In both cases, it can see the statements Vertica receives and evaluate them against audit rules.
- Applications send SQL traffic toward Vertica.
- DataSunrise observes each request that passes through or across the monitored interface.
- Matching events are written to an internal audit repository and, optionally, forwarded to Syslog or SIEM tools.
- The result is a centralized Vertica audit trail exposed in the DataSunrise web UI and APIs.
The remaining steps describe how to configure this auditing path.
Step 4 – Register Vertica in DataSunrise
First, register Vertica as a monitored database in the DataSunrise console so that the platform understands how to interpret captured SQL:
- Open Configuration → Databases.
- Click Add and choose Vertica as the database type.
- Provide the Hostname, Port, Database, and a service account with sufficient privileges to see the needed objects.
- Select whether this instance will be audited via proxy mode or sniffer mode.
- Click Test to confirm that DataSunrise can reach the Vertica instance.
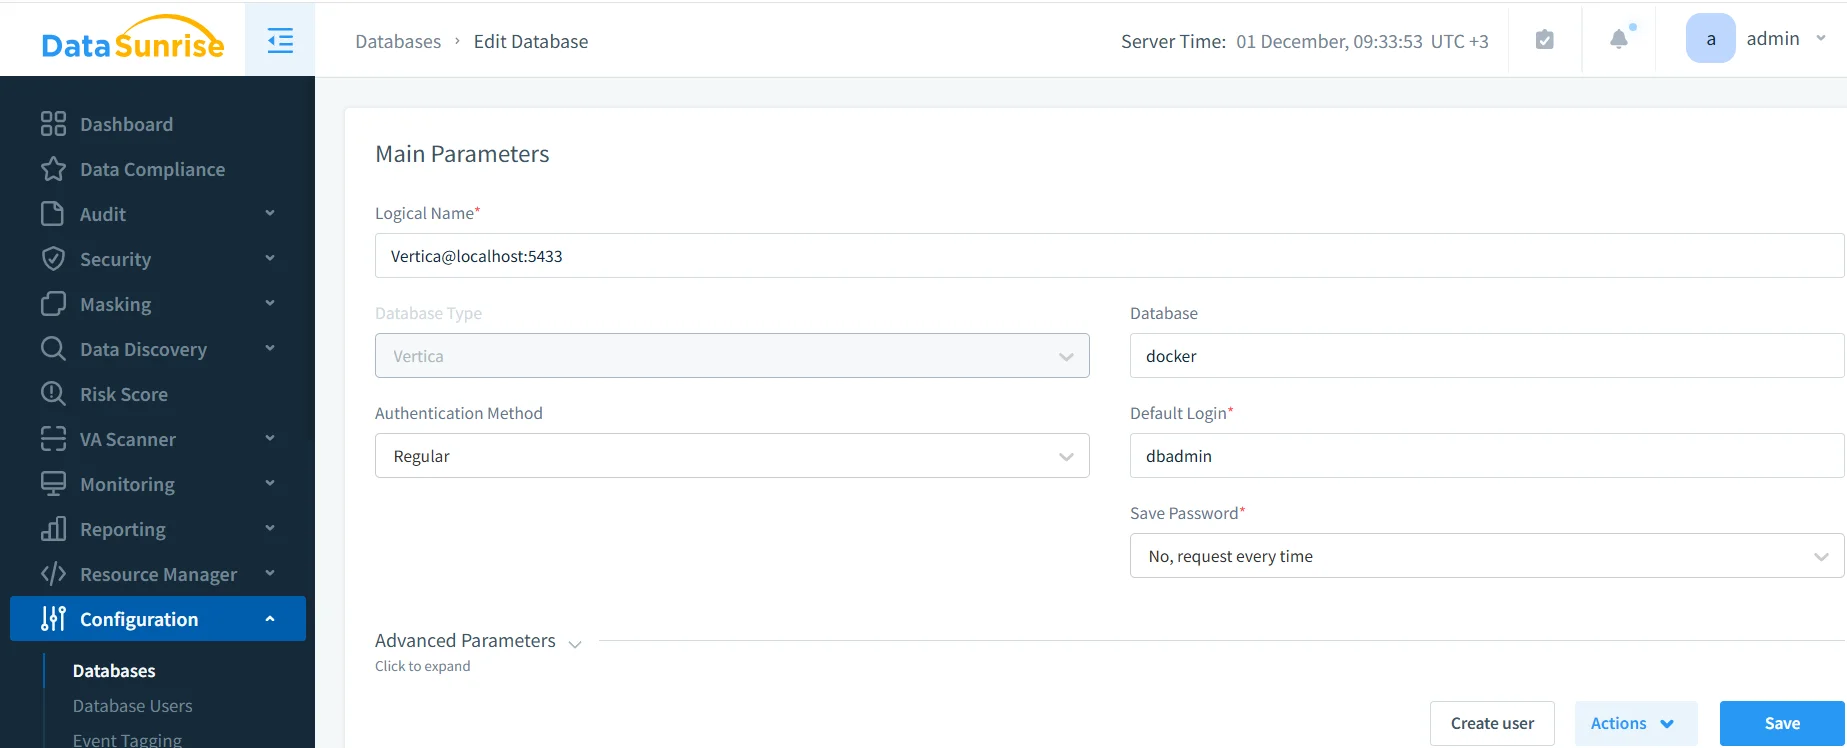
Registering a Vertica instance in DataSunrise. Once the connection is validated, Vertica traffic that flows through the monitored path can be audited.
After this step, DataSunrise can associate captured SQL with a specific Vertica database and display it correctly in the audit interface.
Step 5 – Create an Audit Rule for Vertica
Next, you define which Vertica operations should be treated as audit events. DataSunrise uses audit rules to control what gets logged and where the logs go:
- Open Audit → Rules.
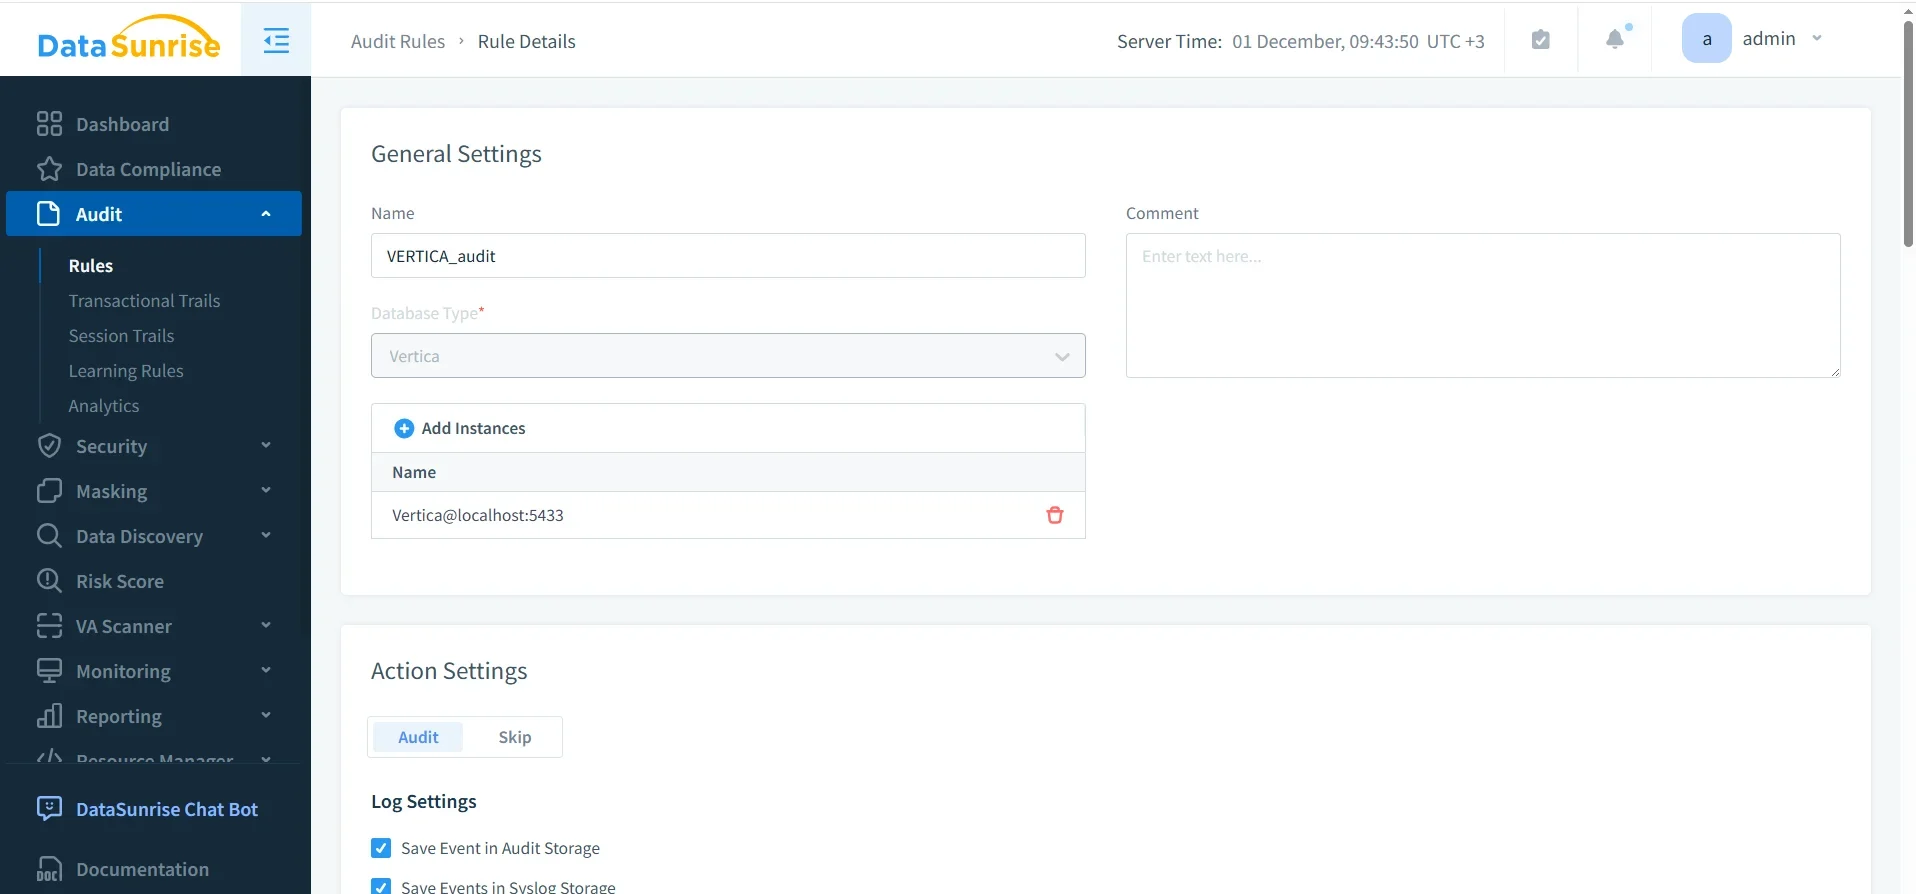
- Create a new rule such as VERTICA_audit.
- Select the Vertica instance from the database list.
- On the query types tab, select the operations to log (for example, SELECT, INSERT, UPDATE, DELETE, and DDL).
- Optionally restrict the rule to specific schemas or tables, such as those containing regulated data.
- Configure log settings: save to internal audit storage, Syslog, or both.
- Enable the rule and save the configuration.
From this point forward, any Vertica request that matches the rule’s conditions is written to the DataSunrise audit repository.
Step 6 – Validate the Vertica Audit Trail in Transactional Trails
To verify that auditing works as expected, generate some test activity through the monitored route (for example, open and close a session, change a setting, and run a DDL statement), then review the results:
- Go to Audit → Transactional Trails.
- Filter by Database Type = Vertica and by your audit rule (e.g., VERTICA_audit).
- Inspect the captured queries, timestamps, and row counts.
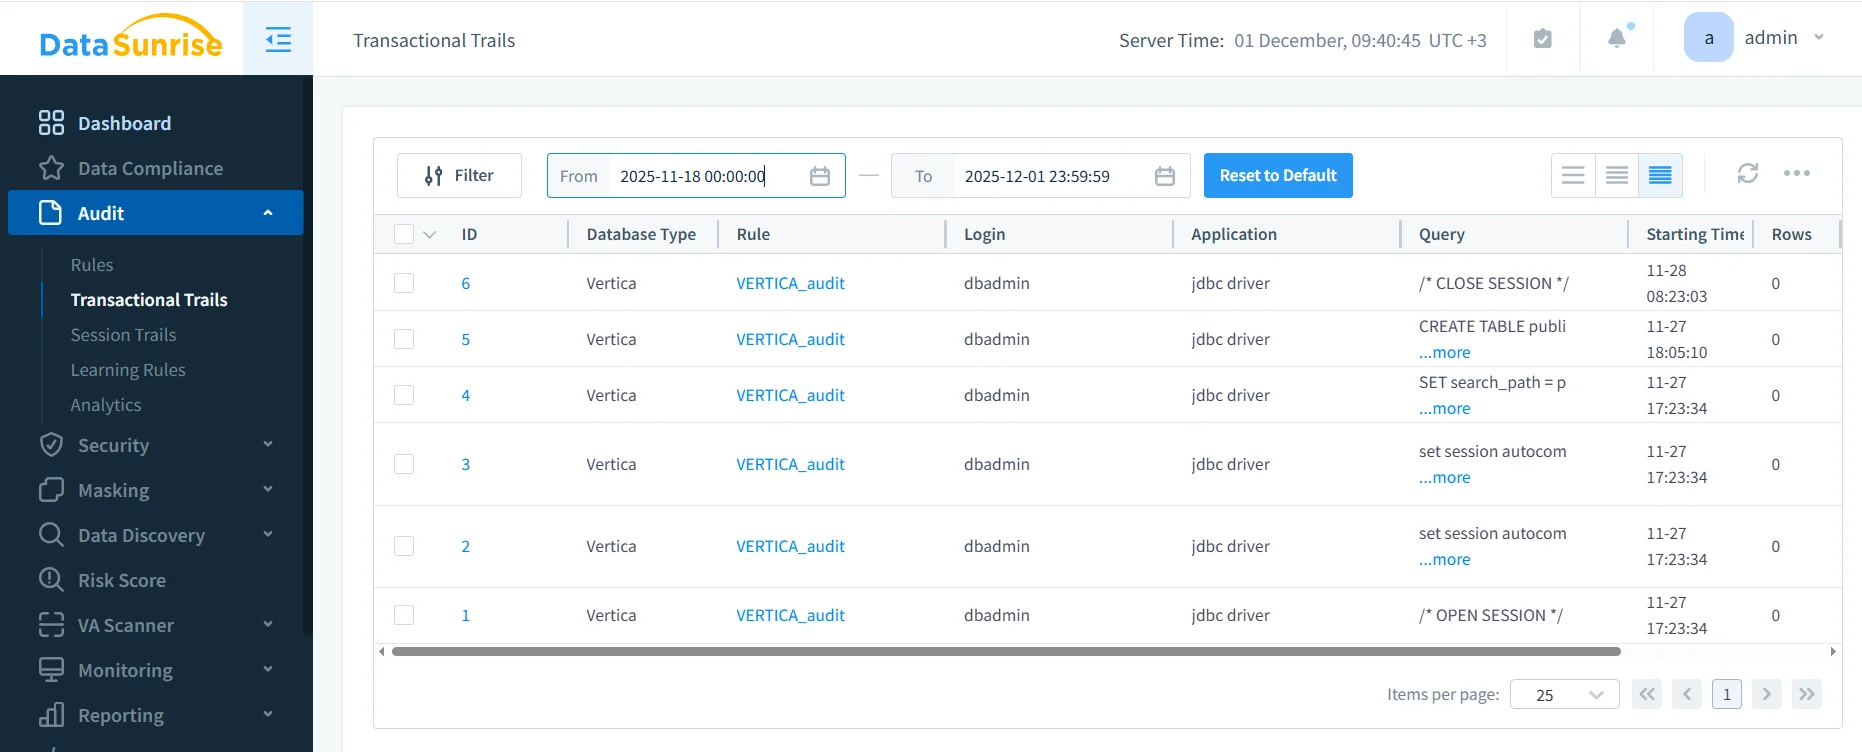
Vertica audit results in DataSunrise Transactional Trails. The VERTICA_audit rule logs DDL and session-related statements executed by the JDBC driver, with timestamps and row counts.
You should now see audit entries that match the test activity you executed. If events appear correctly, Vertica auditing through DataSunrise is functioning.
Step 7 – Map Audit Tasks to Native Vertica vs DataSunrise
The table below shows how common auditing tasks differ when relying only on native Vertica views versus using a DataSunrise-backed Vertica audit trail.
| Audit Task | Using Native Vertica Only | Using DataSunrise Vertica Auditing |
|---|---|---|
| Review recent queries | Run SELECT on v_monitor.query_requests and filter manually |
Open Transactional Trails, filter by Vertica, user, or rule; export if needed |
| Log changes to sensitive schemas | Parse engine logs or craft queries to find DDL statements touching those objects | Create an audit rule scoped to those schemas; DDL appears automatically in the audit trail |
| Correlate events across clusters | Connect to each cluster and merge results by hand or with custom scripts | DataSunrise centralizes events from all Vertica instances into one repository |
| Generate compliance reports | Export CSV from DBeaver and format reports externally | Use built-in reporting or Compliance Manager to build recurring audit reports |
Step 8 – Best Practices for Auditing Vertica
Once the basics are in place, a few practices help keep your Vertica auditing both effective and manageable:
- Define audit rules for schemas that store regulated, financial, or otherwise sensitive data.
- Combine Transactional Trails with Session Trails to reconstruct full user journeys.
- Choose retention periods that align with regulatory requirements and storage capacity.
- Review audit reports regularly with security and compliance stakeholders.
- Use user behavior analysis to highlight unusual patterns instead of manually scanning every statement.
Conclusion
Auditing Vertica starts by understanding what the database already records in v_monitor and engine logs. Those native sources provide the raw facts: who executed which statements and when. To build a sustainable audit practice, you add DataSunrise as a dedicated audit layer that can capture SQL traffic, apply consistent rules, centralize history, and present audit data in a form that security, risk, and compliance teams can rely on.
By registering Vertica in DataSunrise, creating focused audit rules, and validating results in Transactional Trails, you move from occasional log scraping to a structured, repeatable auditing workflow. The outcome is a Vertica audit trail that aligns with data compliance regulations, supports incident response, and provides lasting visibility into how your analytical data is accessed and changed.
Protect Your Data with DataSunrise
Secure your data across every layer with DataSunrise. Detect threats in real time with Activity Monitoring, Data Masking, and Database Firewall. Enforce Data Compliance, discover sensitive data, and protect workloads across 50+ supported cloud, on-prem, and AI system data source integrations.
Start protecting your critical data today
Request a Demo Download Now