Vertica Audit Log
Vertica is frequently used as the core of analytics platforms where dozens of applications, ETL jobs, and BI tools generate massive volumes of SQL. When something suspicious happens—a failed batch, an unexpected schema change, or a potential security incident—teams must be able to answer a simple question: who did what, when, and how? A well-implemented Vertica audit log provides that visibility by recording key database events and the SQL that triggered them.
This article shows how to work with native Vertica audit information directly from DBeaver and then demonstrates how DataSunrise turns these low-level entries into a centralized, searchable audit trail. We will walk through querying the v_monitor schema, configuring a Vertica audit rule in DataSunrise, and comparing native logs with the enriched view in DataSunrise Audit Logs and Database Activity Monitoring. For reference on all available system tables and parameters, consult the official Vertica documentation.
Understanding Vertica Audit Logs
Vertica does not expose a single monolithic “audit_log” table. Instead, it records audit-relevant information in several system views and log files. The two main building blocks are:
- Engine audit log files – OS-level log files that contain authentication attempts, privilege changes, and certain system events.
v_monitorviews – SQL-queryable tables that show executed requests, active and historical sessions, and various monitoring events.
Together, these sources can answer core questions required by security, compliance, and operations teams:
- Which account attempted to log in to the cluster and from where?
- What SQL statement dropped or altered a sensitive table?
- Which queries were running at the time of an incident?
- How often do authentication failures or errors occur?
The following sections use DBeaver and DataSunrise to make this information accessible and actionable.
Viewing Native Vertica Audit Information in DBeaver
Because the v_monitor schema is exposed like any other set of tables, you can use DBeaver to explore Vertica’s audit-related views. One of the most useful is v_monitor.query_requests, which records each executed statement along with user, timing, and success information.
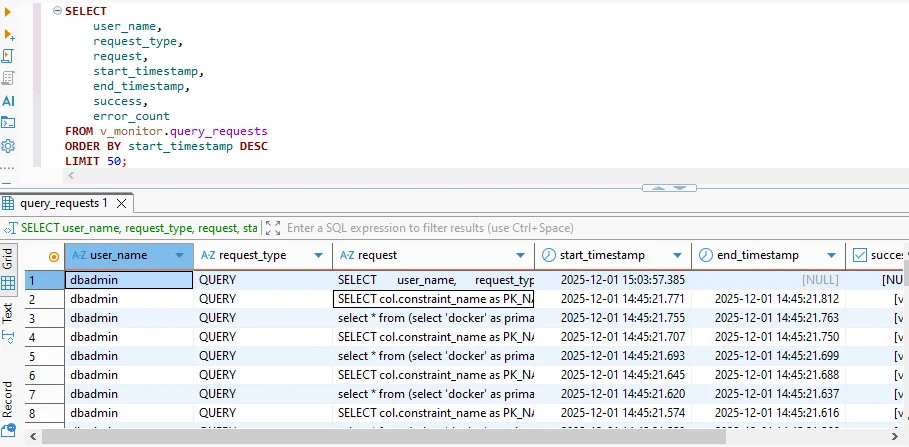
Querying v_monitor.query_requests from DBeaver. Each row represents an executed request, including user name, request type, full SQL text, start and end timestamps, and success status.
A typical query to build a native Vertica audit log looks like this:
SELECT
    user_name,
    request_type,
    request,
    start_timestamp,
    end_timestamp,
    success,
    error_count
FROM v_monitor.query_requests
ORDER BY start_timestamp DESC
LIMIT 50;
This output already behaves like an audit log: you see which users executed which statements and when, along with any errors. You can extend the query with additional columns from v_monitor.sessions (for client address and application name) or join to catalog tables to attach object metadata.
Key Fields in a Vertica Audit Log
While Vertica’s system views contain many columns, a practical audit report usually focuses on a core subset. The table below describes the most important fields and how they are used during investigations.
| Field | Purpose | Example |
|---|---|---|
user_name |
Identity of the database user that executed the statement | dbadmin |
request_type |
High-level category such as QUERY, DDL, COPY, or LOAD | QUERY |
request |
Full SQL text of the operation (or a truncated snippet) | SELECT col.constraint_name AS pk_name FROM v_catalog... |
start_timestamp |
Time at which Vertica began executing the request | 2025-12-01 15:03:57.385 |
end_timestamp |
Completion time; used to measure run-time and overlap with incidents | 2025-12-01 15:03:58.010 |
success |
Boolean flag indicating whether the statement finished successfully | true |
error_count |
Number of errors that occurred while processing the request | 0 |
With these fields, DBeaver already gives you a working Vertica audit log. You can filter by user, search for specific SQL patterns, or export results as CSV for further analysis. However, this approach still has some limitations: history is bound to a single cluster, log retention follows engine settings, and correlating events across systems is manual.
Limitations of Relying Only on Native Logs
Native audit logs provide great depth but limited reach. Each Vertica cluster keeps its own history, and log rotation can silently discard older records. You may also need to stitch together information from multiple views and join it with catalog metadata. If you operate several environments—development, staging, production—or combine Vertica with other databases, this quickly becomes hard to manage.
In addition, engine logs and v_monitor views do not automatically categorize events by business rules. For example, you might want a dedicated log of “all DDL changes in the finance schema” or “all access to PII columns” with alerts for violations. Implementing this only with native logs means writing and maintaining your own scripts and scheduled queries.
Centralizing Vertica Audit Logs with DataSunrise
DataSunrise addresses these challenges by acting as an audit layer in front of Vertica. It captures every SQL statement, maps it to a user, application, and database, evaluates it against configurable rules, and writes the result to a central audit repository. This repository can span many Vertica clusters and other data platforms, giving you a unified view of database activity.
To enable auditing, you register Vertica as a data source in the DataSunrise console and then create an audit rule—such as “Vertica Audit Log”—that specifies which queries and events to log. Once the rule is active, every matching operation appears in the Transactional Trails interface.
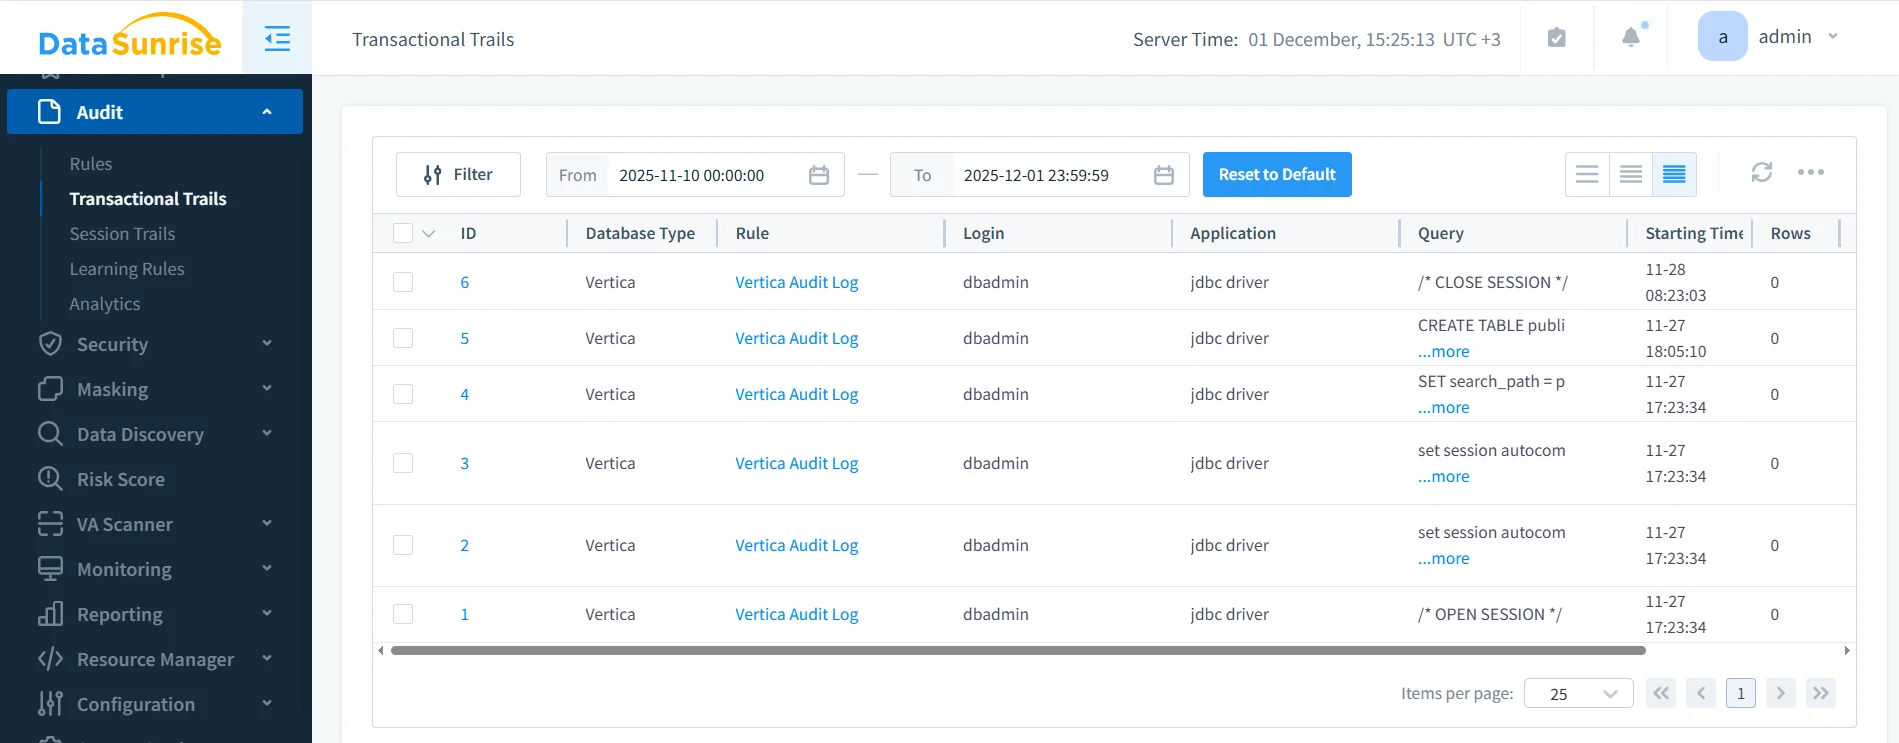
DataSunrise Transactional Trails showing Vertica audit log events. Each row represents a captured operation, including database type, audit rule name, user login, client application, SQL query, start time, and row count.
Unlike raw engine logs, this view is designed for investigation and reporting. You can filter by rule (for example, “Vertica Audit Log”), zoom into specific users, or search for a particular table or statement pattern. Events can also be forwarded to SIEM or SOAR platforms using built-in Syslog or webhook integrations, avoiding custom log parsing.
How DataSunrise Enriches Vertica Audit Logs
DataSunrise does more than simply mirror native logs. Because it sees every SQL request at the network layer, it can:
- Capture full query text even when Vertica truncates internal logs.
- Apply audit rules by schema, table, user, or operation type without modifying application code.
- Correlate events across platforms such as Vertica, PostgreSQL, Oracle, and cloud warehouses in a single console.
- Feed higher-level features like User Behavior Analysis and Compliance Manager, which rely on normalized audit data.
- Provide flexible retention and reporting via scheduled audit reports and export to external storage.
In practice, organizations often use native Vertica logs for deep technical troubleshooting and rely on DataSunrise for day-to-day security monitoring and compliance evidence. This combination delivers both the low-level accuracy of engine logs and the high-level clarity of a specialized audit platform.
Putting It All Together
Implementing a comprehensive Vertica audit log strategy does not require abandoning native tools. Instead, you can start by querying v_monitor.query_requests and related views from DBeaver to understand how Vertica records activity. These views reveal who ran which SQL statements, when they ran, and whether they succeeded.
From there, you can connect Vertica to DataSunrise, create targeted audit rules, and use Transactional Trails to maintain a centralized, long-lived audit log that spans all your environments. By aligning native Vertica history with DataSunrise’s advanced monitoring, behavior analytics, and data compliance toolset, you give security and operations teams a single source of truth for investigating incidents, validating controls, and proving that sensitive data remains protected.
Protect Your Data with DataSunrise
Secure your data across every layer with DataSunrise. Detect threats in real time with Activity Monitoring, Data Masking, and Database Firewall. Enforce Data Compliance, discover sensitive data, and protect workloads across 50+ supported cloud, on-prem, and AI system data source integrations.
Start protecting your critical data today
Request a Demo Download Now