Vertica Database Activity History
Vertica often serves as the analytical core for reporting platforms, BI dashboards, and high-volume data pipelines. When something goes wrong in that environment, teams need more than a single audit record. They need to reconstruct the full Vertica database activity history around a problem: which queries executed, how they behaved, and which users or applications triggered them. This article explains how Vertica exposes native activity history, and how DataSunrise enriches that signal to create a unified operational view.
DataSunrise complements Vertica’s built-in monitoring by capturing SQL traffic, normalizing events, and storing them in a central repository. Combined with capabilities such as Database Activity Monitoring, Database Activity History, and Data Activity History, it turns low-level logs into a consistent timeline of database behavior. For details about native metrics and system tables, the official Vertica documentation remains a useful companion.
Why Activity History Matters for Vertica
Database activity history focuses on execution details rather than only on who ran a specific statement. Engineers and analysts can use it to answer questions such as:
- Which queries dominated CPU, I/O, or memory during a performance incident?
- Did a new ETL job change the shape of workloads across a given week?
- Which application accounts produce the most failed or long-running statements?
- How do activity patterns differ between peak and off-peak business hours?
This operational view complements traditional data audit and audit logs. Audit trails focus on accountability and compliance, while database activity history reveals how Vertica behaves as a system under changing workloads.
Native Vertica Components for Activity History
Vertica already records a rich set of details about query execution. Administrators can query system views and diagnostic logs to reconstruct what happened inside a cluster.
v_monitor.query_requests– lists recent requests with user name, request type, SQL text snippet, timestamps, status, and error counters.- Session views – such as
v_monitor.sessionsand related tables, which show active and historical sessions, client addresses, and application names. - Execution and resource views – including
v_monitor.execution_engine_profilesfor detailed per-step statistics and views for CPU, memory, and disk usage. - Diagnostic logs – engine log files that capture low-level events, configuration changes, and error messages.
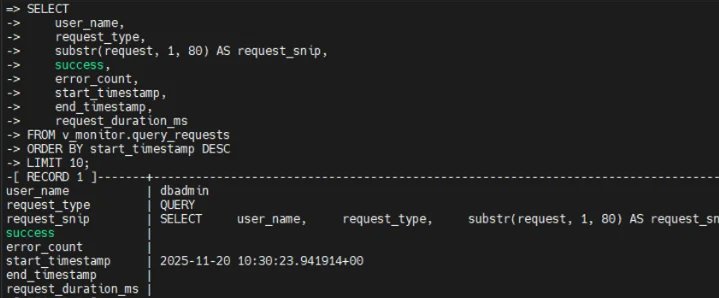
Query against v_monitor.query_requests returning execution history for recent requests, including user, request type, SQL snippet, timestamps, and success indicator.
These components together provide a trustworthy, low-level history of database activity. However, they remain local to each cluster and require custom queries or scripts to analyze trends, correlate activity across systems, or feed SIEM and observability tools. To simplify that work, many teams add a dedicated activity-monitoring layer around Vertica.
Extending History with DataSunrise in Sniffer Mode
DataSunrise can observe Vertica traffic either as a proxy or by using sniffer mode. With sniffer mode, the platform listens to network traffic between applications and Vertica without changing connection strings. It then parses SQL, applies rules, and records events in its own history store.
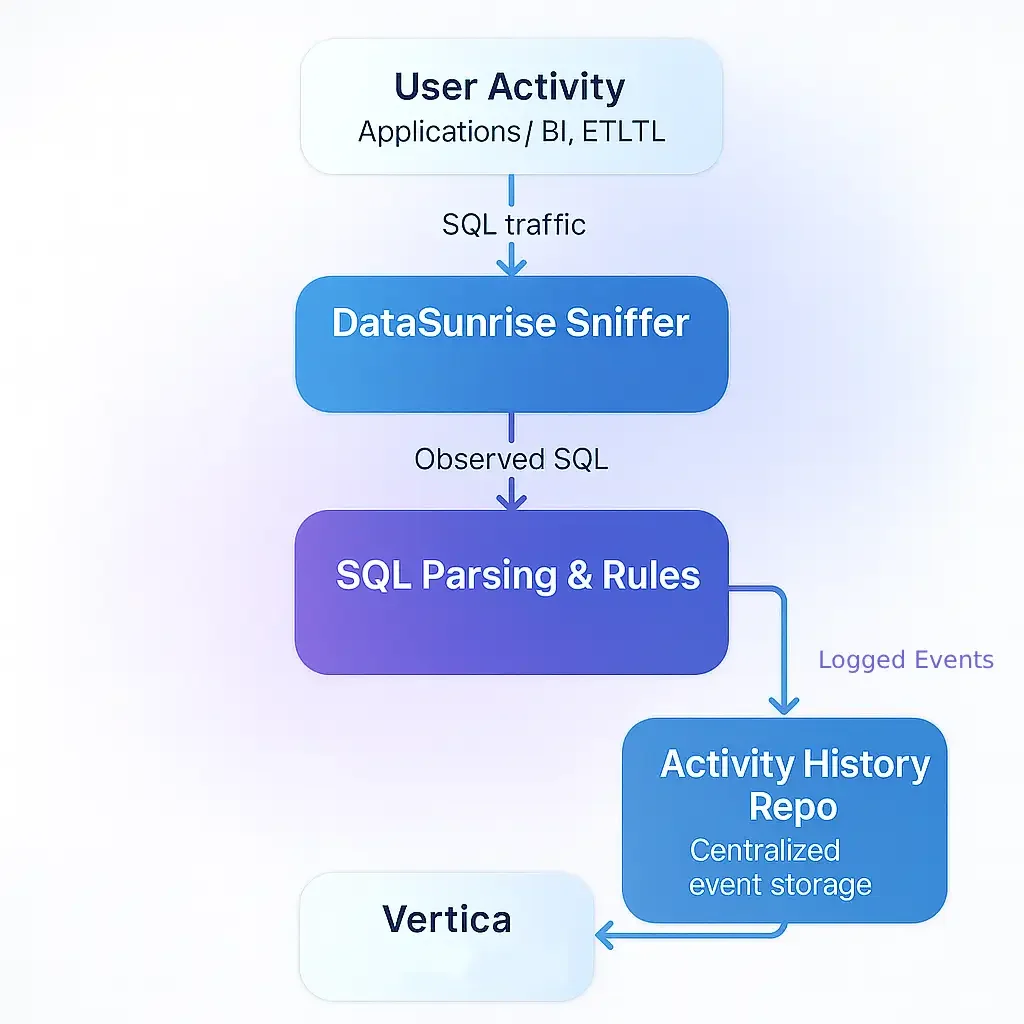
Vertica database activity history in sniffer mode: DataSunrise listens to SQL traffic, parses statements, applies rules, forwards them to Vertica, and saves normalized events in the activity history repository.
This approach combines native Vertica telemetry with an external activity history that spans multiple clusters and other platforms. It also enables higher-level analytics such as user behavior analysis and data-inspired security, which rely on consistent, cross-system event data.
Configuring Vertica as a Monitored Source
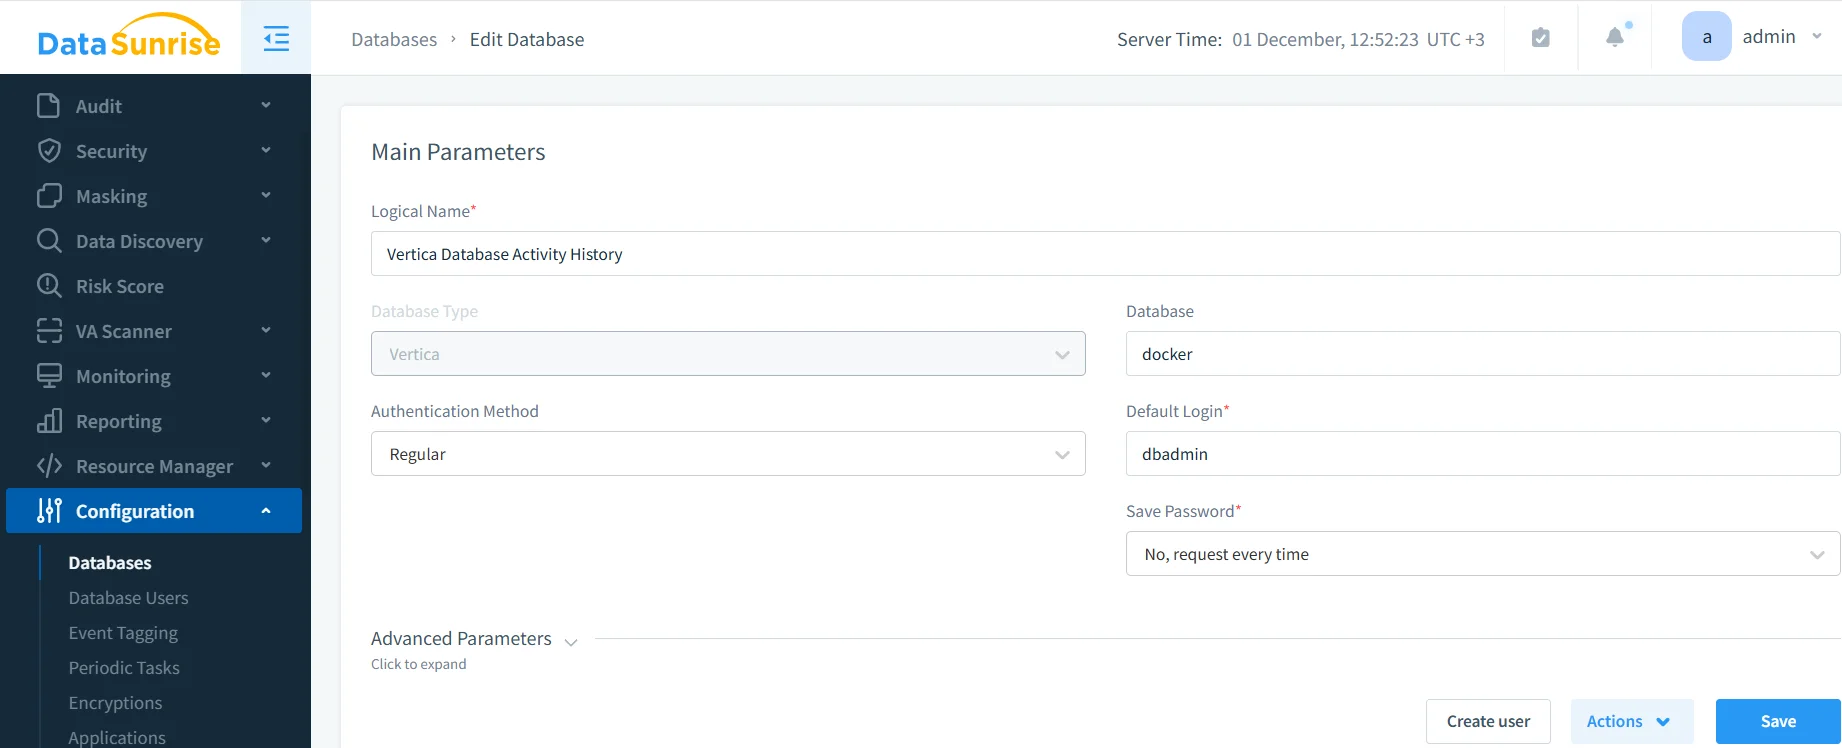
To start collecting activity, administrators register Vertica as a database in the DataSunrise console. They specify connection parameters, default login, and authentication method. Even in sniffer mode, this configuration provides the metadata DataSunrise needs to interpret captured traffic correctly.
After administrators save the configuration and complete the network setup described in the Deployment Modes and Reverse Proxy guides, DataSunrise begins to observe Vertica traffic and build a central history of database activity.
Creating Rules for Database Activity History
Next, teams decide which events should enter the history store. In DataSunrise this happens through audit and monitoring rules that specify the database, objects, and query types to track.
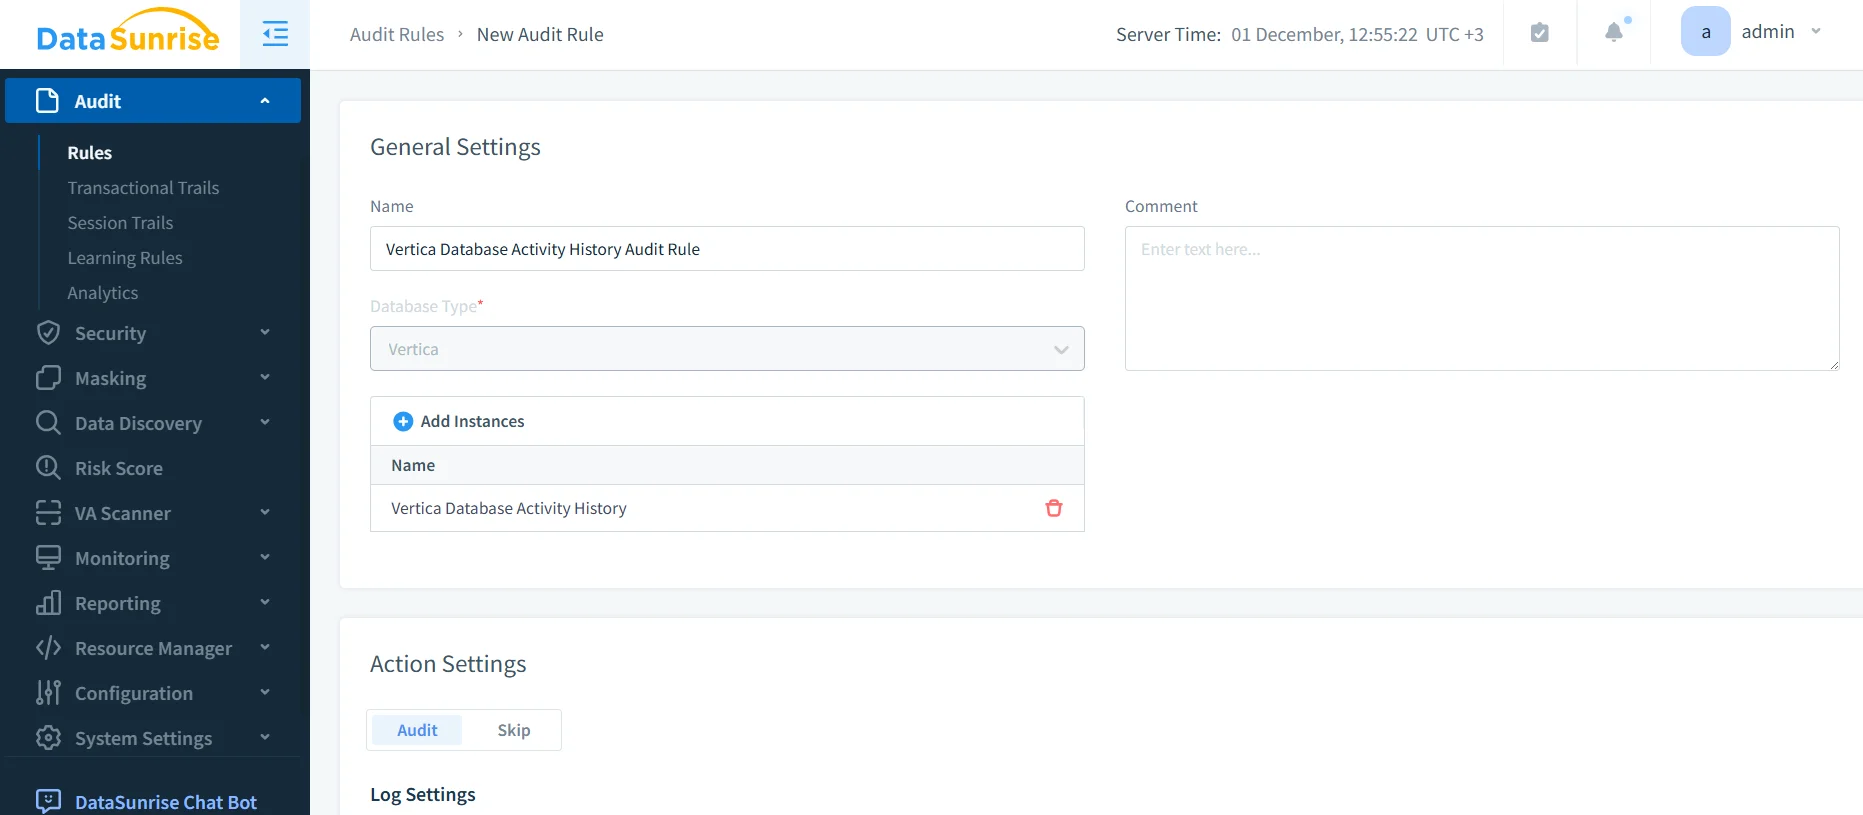
Rules can separate read and write operations, focus on specific schemas, or highlight sensitive tables that require closer monitoring. The same rule set later supports Database Activity Monitoring, classic audit trails, and Vertica database activity history views. This reuse reduces configuration drift and keeps monitoring policies consistent.
Analyzing Events in Transactional Trails
Once logging rules take effect, every captured operation becomes part of the shared history. DataSunrise exposes that history through the Audit → Transactional Trails view, which shows Vertica activity alongside events from other databases.
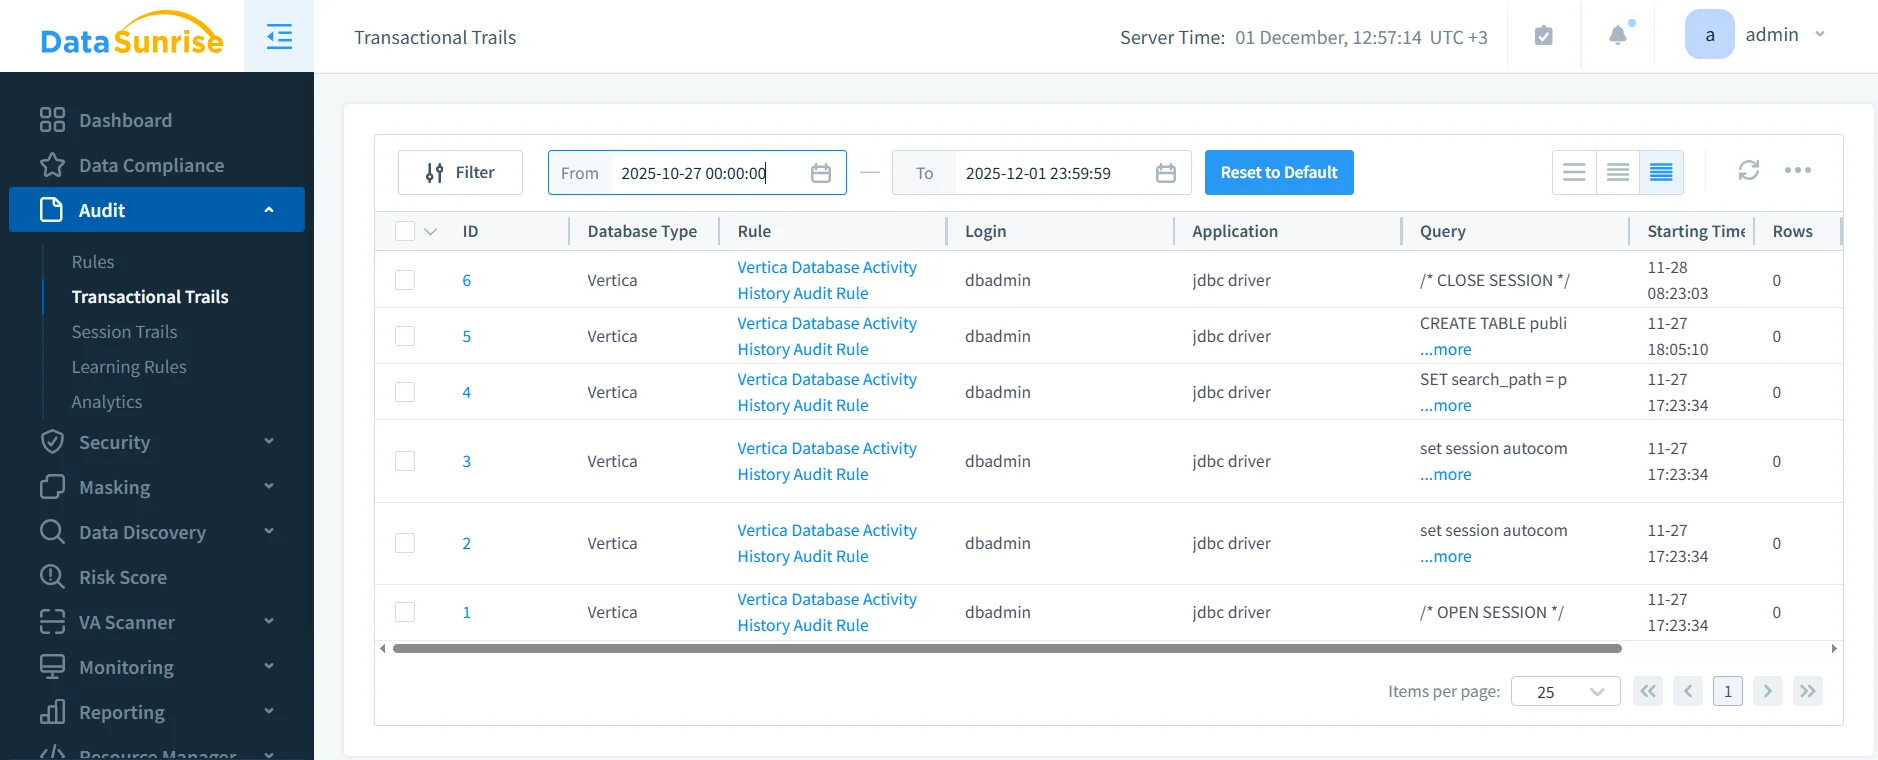
Analysts can filter events by rule, database type, user, query type, or error status. They can also export results for offline analysis or stream them into SIEM platforms. This unified interface speeds up investigations that would otherwise require multiple Vertica queries and log file inspections.
Native History and DataSunrise: Side-by-Side
Native Vertica features and DataSunrise provide different but complementary views of database activity. The table below summarizes their roles.
| Capability | Native Vertica | DataSunrise Layer |
|---|---|---|
| Query execution details | v_monitor views and engine logs show per-query metrics |
Normalizes events from Vertica and other platforms into a common schema |
| Retention and storage | Cluster-local history with limited retention | Configurable long-term storage suitable for audits and trend analysis |
| Cross-system correlation | Requires custom tooling across clusters | Central console correlates activity from many databases and data stores |
| Security and risk analysis | Manual queries against system views | Built-in analytics, vulnerability assessment, and behavior models |
By leaning on both sides of this table, organizations retain the precision of Vertica’s engine-level metrics while gaining the convenience of centralized visibility and reporting.
Advanced Use Cases for Database Activity History
With a complete history in place, teams can go beyond basic troubleshooting:
- Performance regression analysis: compare activity before and after a release or schema change.
- ETL workload validation: verify that new data pipelines follow expected schedules and do not overload Vertica clusters.
- Security anomaly detection: identify unusual query patterns or access from unexpected locations using role-based access control context and behavior baselines.
- Compliance and audit preparation: provide auditors with consistent, queryable event history instead of a collection of disconnected log files.
These scenarios show how database activity history supports both day-to-day operations and longer-term governance initiatives, especially when combined with database security controls.
Conclusion
A detailed Vertica database activity history gives teams the context they need to understand how queries behave, how workloads evolve, and how users interact with critical data. Vertica’s native system views and diagnostic logs already provide a strong foundation, but they work best alongside a centralized platform that can store, correlate, and analyze events over time. DataSunrise fills that role by capturing Vertica traffic in sniffer or proxy mode, applying flexible rules, and presenting a unified activity history across many systems.
By combining both perspectives, organizations move from reactive firefighting to proactive insight. They can investigate incidents faster, tune workloads more effectively, and demonstrate that their Vertica clusters operate in line with internal policies and external regulations such as those described in data compliance regulations. In practice, that means fewer surprises, more predictable performance, and a clearer understanding of how valuable analytical data moves through the environment.
Protect Your Data with DataSunrise
Secure your data across every layer with DataSunrise. Detect threats in real time with Activity Monitoring, Data Masking, and Database Firewall. Enforce Data Compliance, discover sensitive data, and protect workloads across 50+ supported cloud, on-prem, and AI system data source integrations.
Start protecting your critical data today
Request a Demo Download Now