Vertica Data Activity History
Vertica serves as the analytical backbone for many reporting systems, BI dashboards, and large-scale data pipelines. In such environments, understanding how workloads evolve over time matters just as much as inspecting individual audit events. A well-designed Vertica data activity history shows how sessions, queries, and users behave day after day, so teams can optimize performance, track anomalies, and present clear evidence for security and compliance investigations.
DataSunrise extends native Vertica monitoring by collecting, normalizing, and storing detailed activity information. Together with features like Database Activity Monitoring, Data Activity History, and Database Activity History, it turns raw Vertica traffic into a long-term source of operational intelligence. For details about native engine metrics, you can also consult the official Vertica documentation, which describes system tables and monitoring views.
Why Activity History Matters in Vertica
Activity history focuses on patterns rather than isolated events. Instead of asking only “who ran this query,” teams can answer broader questions such as:
- Which workloads consistently put the most pressure on Vertica resources?
- How do peak periods differ between business units, applications, or regions?
- Which users or service accounts gradually change their behavior over time?
- Where do performance problems correlate with specific SQL patterns or job schedules?
This perspective complements traditional data audit and audit logs. Instead of treating monitoring as a collection of one-off incidents, Vertica data activity history shows how the environment behaves as a living system and how that behavior changes over weeks and months.
Native Vertica Capabilities for Activity History
Vertica already offers several mechanisms that capture useful activity information:
- Session metadata that records connections, disconnections, and client information.
v_monitorviews that expose query text, timing statistics, resource usage, and error codes.- Diagnostic and system logs that record engine-level events and configuration changes.
These tools deliver a valuable “raw feed” of Vertica behavior. However, teams must query multiple views and log files, and each cluster keeps its own history. As a result, organizations often centralize activity history in a dedicated platform to achieve long-term retention and cross-environment correlation.
How DataSunrise Builds the Activity History Layer
DataSunrise acts as a transparent proxy in front of Vertica. It receives SQL from applications, parses the statements, applies rules, forwards requests to the database, and writes activity events to persistent storage. The following diagram illustrates this flow at a high level:
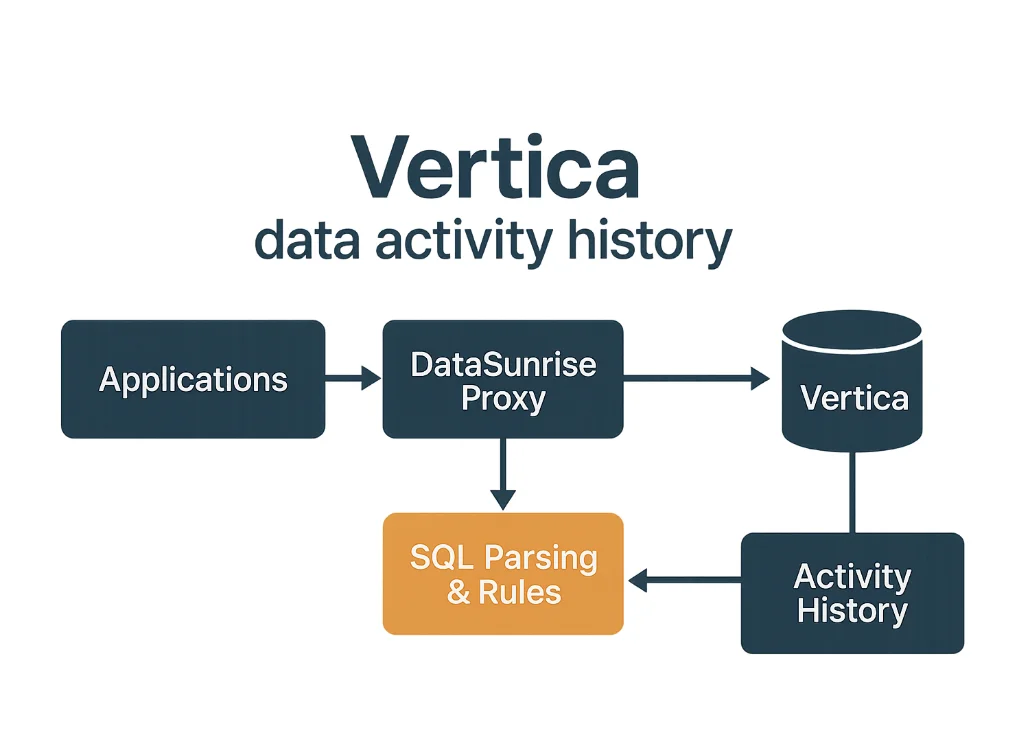
Because this architecture remains independent of any particular client, it captures traffic from BI tools, ETL jobs, custom microservices, and ad-hoc SQL sessions in a consistent way. In addition, DataSunrise can generate alerts and reports via User Behavior Analysis and Compliance Manager, turning historical records into actionable insights.
Configuring Vertica as a Data Source
The first practical step is to register Vertica in the DataSunrise console. Administrators specify the hostname, port, authentication method, and database name that the proxy should use to route traffic.
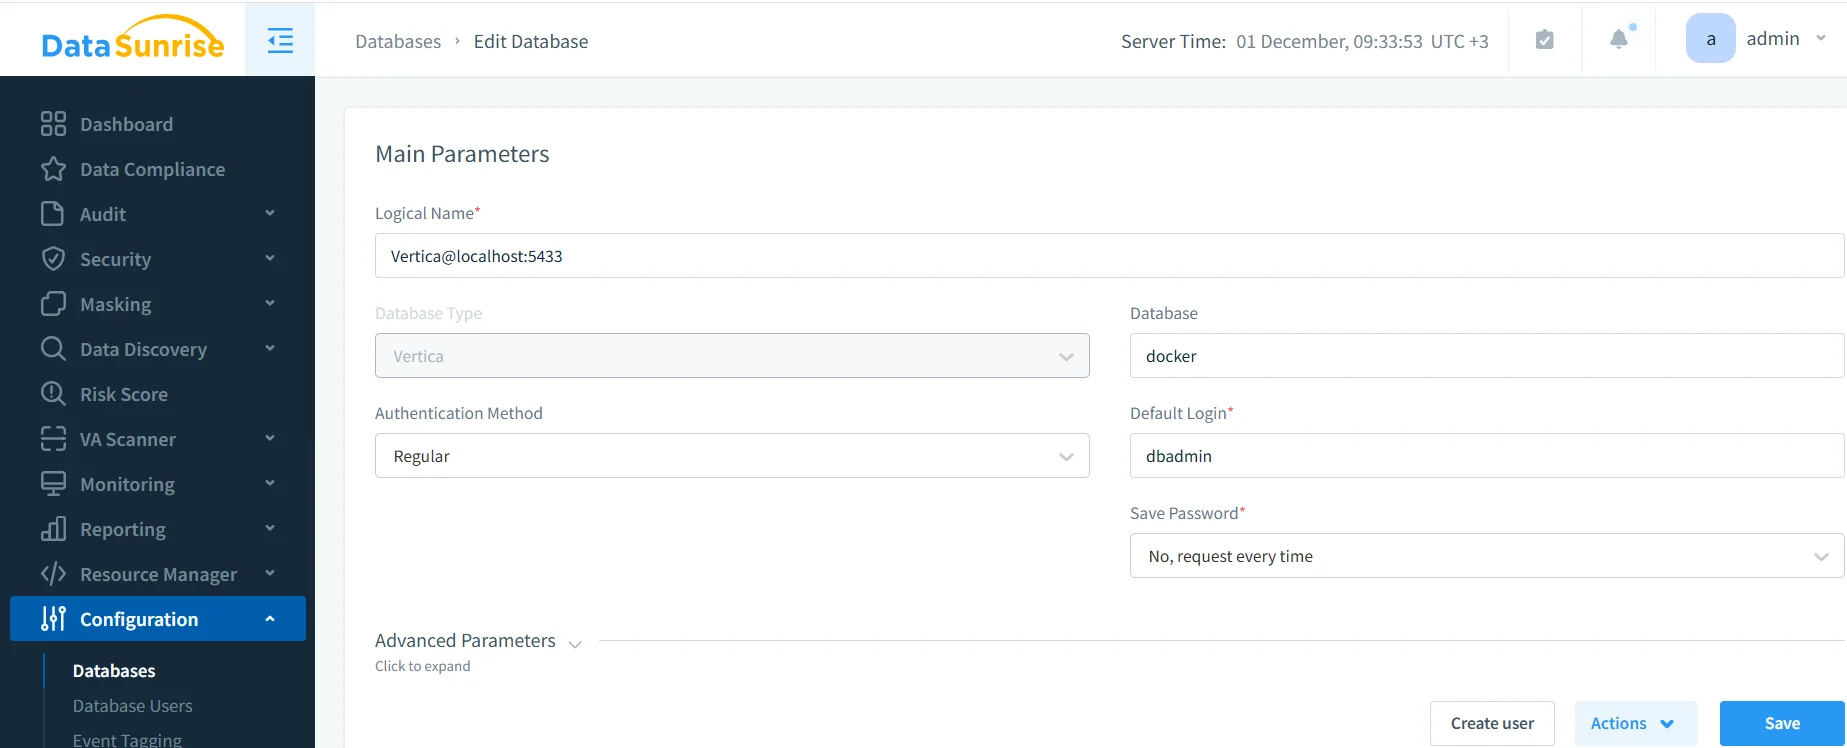
After teams test the connection successfully, they update application connection strings to use the DataSunrise endpoint. From that moment on, every query that flows through the proxy becomes eligible for recording in the activity history.
Defining Rules for Activity History
Next, administrators decide which activity they want to record and how they want to classify it. In DataSunrise this happens through audit and monitoring rules that target specific databases, schemas, and objects.
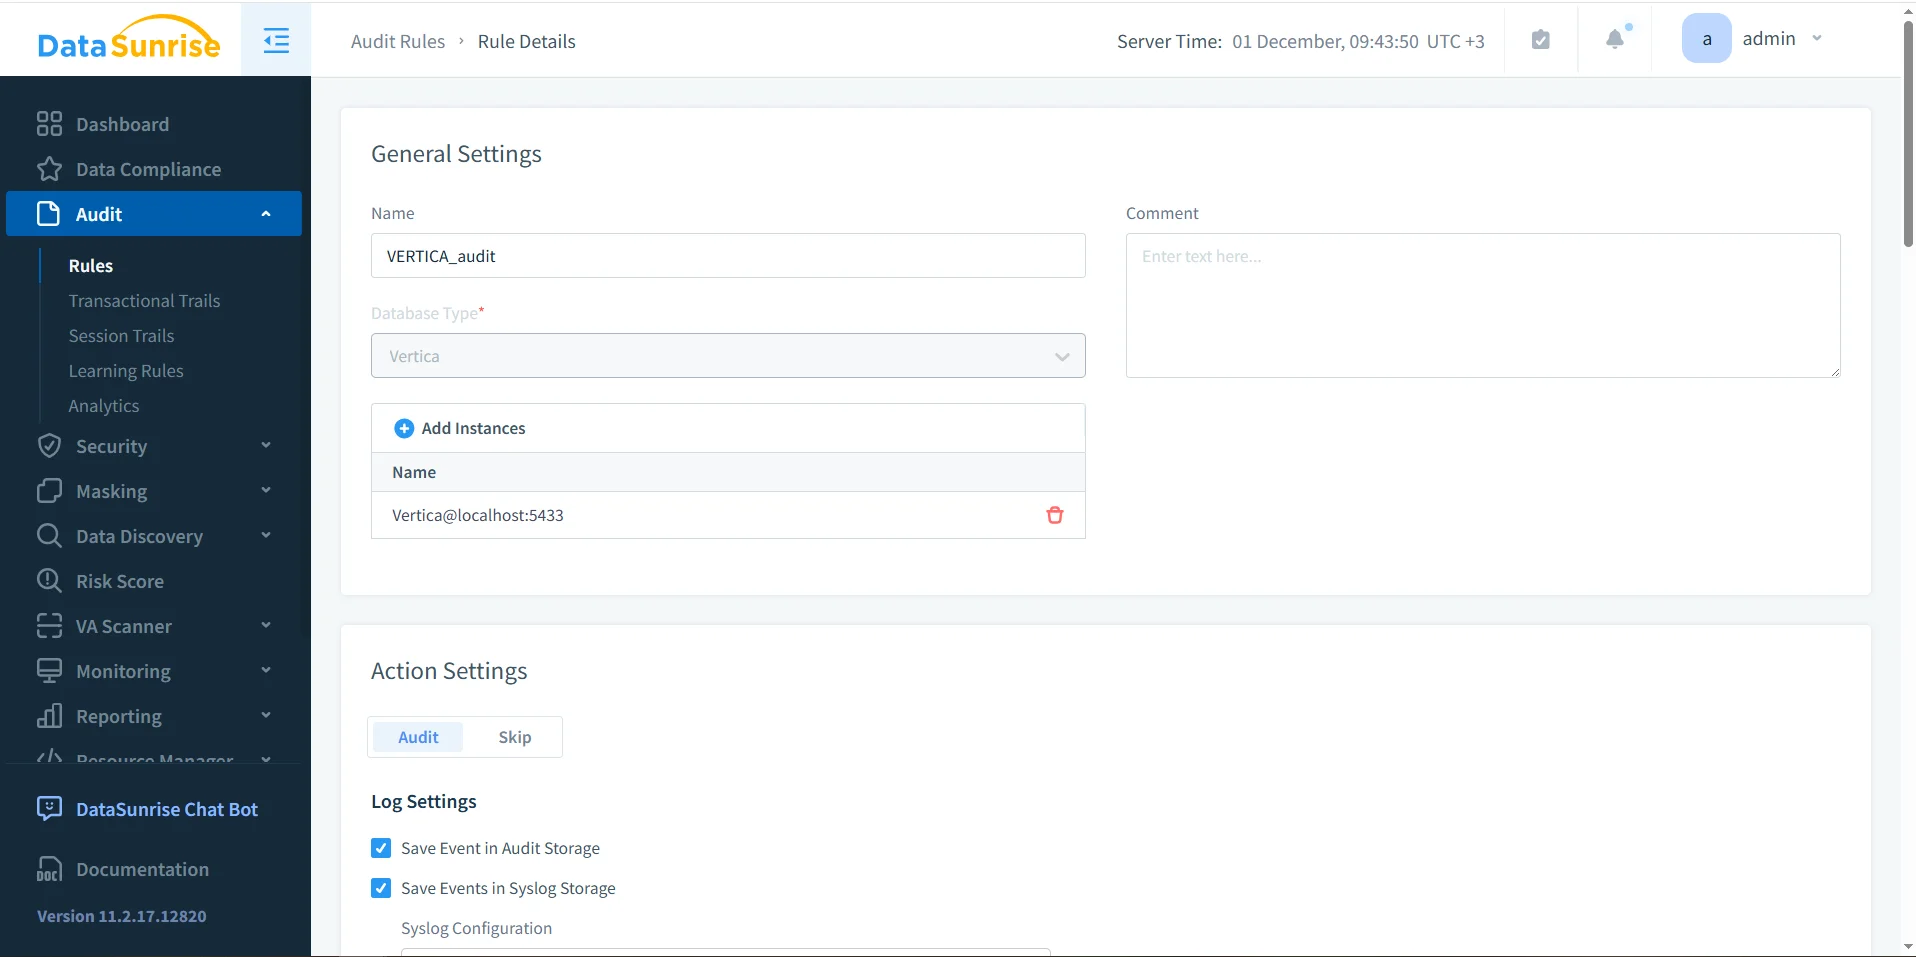
A rule can distinguish between read-only and write operations, separate user-facing schemas from technical ones, and apply different policies for service accounts. The same rule set later supports database activity monitoring, traditional audit trails, and Vertica data activity history views without additional configuration.
Exploring Activity History in Transactional Trails
When logging is enabled, every captured operation becomes part of the historical record. In the DataSunrise UI this record appears in the Audit → Transactional Trails section, where teams can filter events by time range, user, rule, or query type.
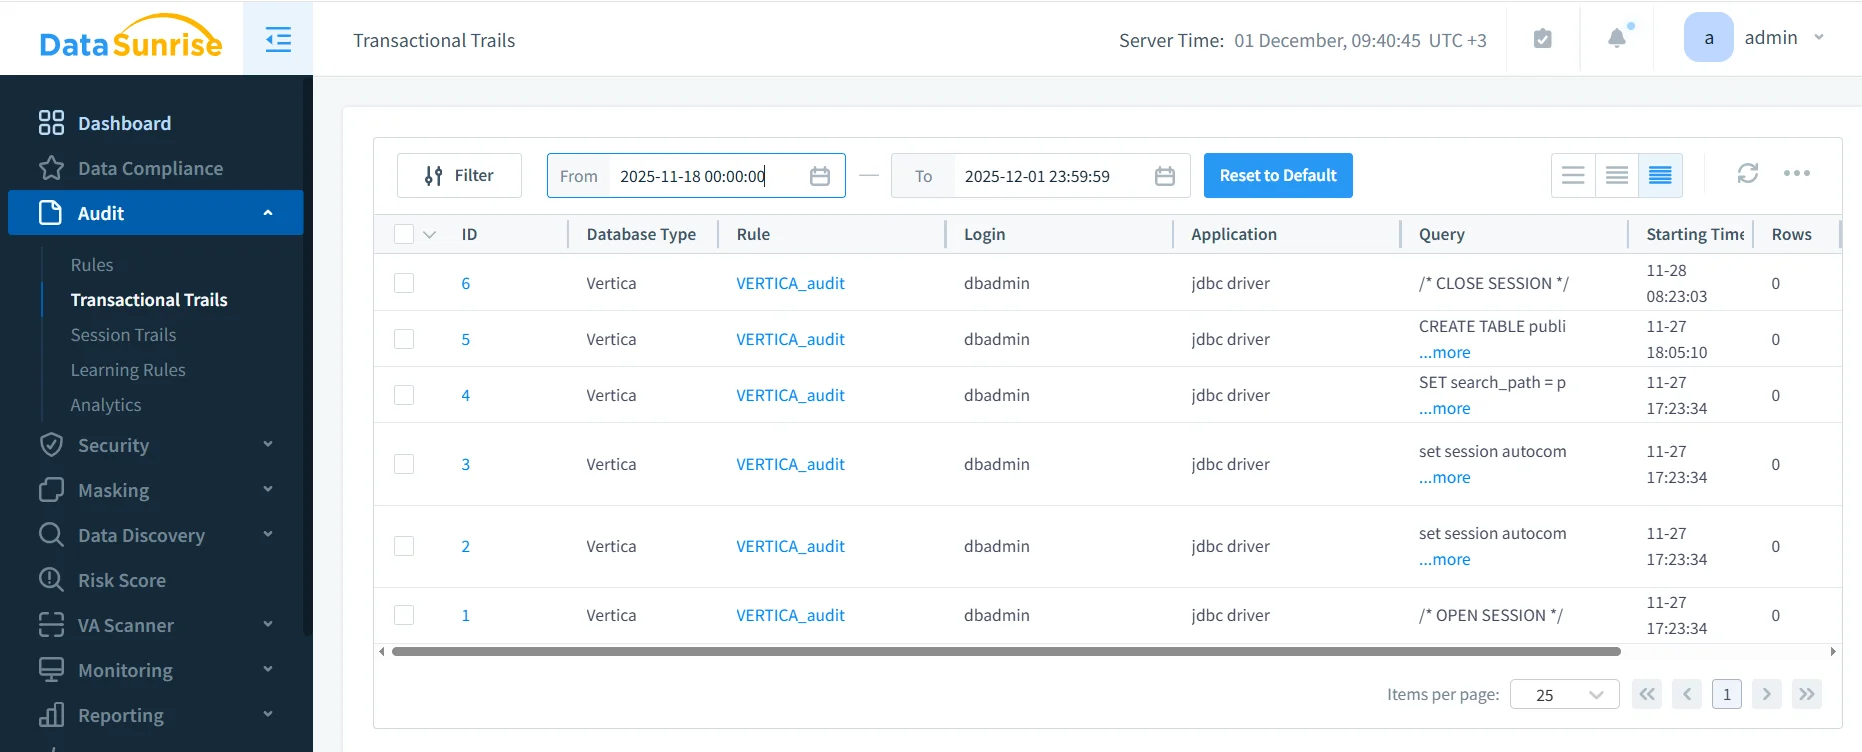
From this view, analysts can drill into specific events, export records for offline analysis, or forward them to SIEM tools. The same dataset also powers higher-level activity history and security analytics, including data-inspired security scenarios.
Interpreting Historical Activity Data
Once the Vertica data activity history has accumulated for some time, teams can analyze trends instead of looking only at single incidents. The table below offers one way to think about typical dimensions in historical datasets.
| Dimension | Example Fields | Questions It Helps Answer |
|---|---|---|
| Time | Hour of day, day of week, month | When does Vertica experience peak load or unusually quiet periods? |
| User & Application | Login, client IP, application name | Which personas or tools generate the most activity and how has their behavior changed? |
| Workload Type | Query type, schema, object name | Which tables or schemas receive the most attention over time? |
| Performance | Duration, row count, error flags | Where do slow or failing queries cluster, and can teams tie them to specific jobs or releases? |
By combining these dimensions, organizations can build dashboards and reports that show how Vertica operates, not just what happened at a specific moment. This view proves particularly valuable when teams align operational patterns with policies defined in data compliance regulations.
Using Activity History for Optimization and Security
Historical activity records open the door to both performance and security improvements:
- Performance tuning: teams identify heavy queries that consistently run during busy periods and work with developers to optimize or reschedule them.
- Capacity planning: engineers correlate activity history with hardware utilization and plan Vertica scaling or workload redistribution.
- Anomaly detection: security analysts use behavior baselines from User Behavior Analysis to highlight new or unusual access patterns.
- Compliance reporting: risk and compliance teams export history to DataSunrise Compliance Manager for periodic reviews and external audits.
In all of these scenarios, Vertica data activity history acts as a reusable evidence base that teams can revisit whenever policies change or new questions arise about past behavior.
Getting Started with Vertica Activity History
Implementing a robust history program does not require a complete redesign of existing infrastructure. Instead, most organizations follow a gradual sequence like the one below:
- Review native monitoring views in Vertica to understand which metrics already exist and how they align with Database Activity History concepts.
- Deploy the DataSunrise proxy in front of Vertica, following documented deployment modes and network requirements.
- Create initial rules that log activity on critical schemas and accounts, using the Audit Guide as a reference.
- Enable long-term storage and integration with SIEM or reporting tools so that history remains available for months or years.
- Iterate based on findings by adding new dimensions, refining rules, and integrating activity history into regular reporting and review cycles.
Conclusion
Vertica data activity history transforms individual SQL events into a continuous narrative of how the database operates. By combining Vertica’s native telemetry with the proxy-based visibility of DataSunrise, organizations gain a timeline of behavior that supports troubleshooting, security analysis, and regulatory reporting. Instead of reacting only when something goes wrong, teams can study long-term patterns, detect subtle changes, and make better-informed decisions about capacity, security posture, and data governance.
For additional background on related concepts, see the articles on Data Activity History and Database Activity Monitoring, which describe how DataSunrise can centralize and analyze activity from Vertica and many other data platforms.
Protect Your Data with DataSunrise
Secure your data across every layer with DataSunrise. Detect threats in real time with Activity Monitoring, Data Masking, and Database Firewall. Enforce Data Compliance, discover sensitive data, and protect workloads across 50+ supported cloud, on-prem, and AI system data source integrations.
Start protecting your critical data today
Request a Demo Download Now